

 Print
Print I am in Colorado this week at a Commonwealth conference, spending some time at high altitude when I normally live pretty much at sea level. The altitude seems somehow appropriate, though, when I look at where the markets are right now compared with where they were 10 years ago. We have climbed to astonishing heights since the bottom—heights almost no one expected back then.
The market: Then and now
Let’s look back at history. On March 9, 2009—10 years ago this Saturday—the S&P 500 bottomed out, closing at 676. Goldman Sachs put out a research report stating that the market could drop to 400. The world financial system was at risk, the economy was imploding, and there were real fears that the economic and financial system was going to collapse. It was a scary time.
Now, of course, everything is awesome! The markets, after a pullback, are pushing back toward new highs. The S&P 500 has quadrupled. Corporate earnings are booming, jobs are more plentiful than ever, and consumer and business confidence are at levels (despite a recent pullback) consistent with a boom.
Much of the commentary around the anniversary of the bottom is bound to focus on just how far we have come and just how good things are right now. And that assessment will be correct. What we should remember, though, is that when you ascend far enough, the air gets thin—as I am finding out as I climb stairs in Colorado. And when the air gets thin? The risks start to rise.
A useful comparison
Current market and economic conditions are best compared not with March 9, 2009, but with a couple of years earlier—when things were booming and everyone was confident. Or, 10 years before that, in March 1999, when the boom was also reaching a peak. When you compare time periods, you want to make a useful comparison. Of course, things are better at a peak than they are at the bottom. The question is, if things are now most like previous peaks, what does that tell us about the future?
That idea is the substance of the talk I am giving to Commonwealth advisors today: things are indeed good and likely to remain so for a while, but the risks are steadily rising.
Take a look at consumer confidence
You can see these rising risks in several ways, the most important of which is how consumer confidence has changed over the past several months. Yes, we saw a pullback, but then confidence bounced back and remains at levels above those of the mid-2000s. Again, this is good news. But put in context, it means that there is more room on the downside than on the upside.
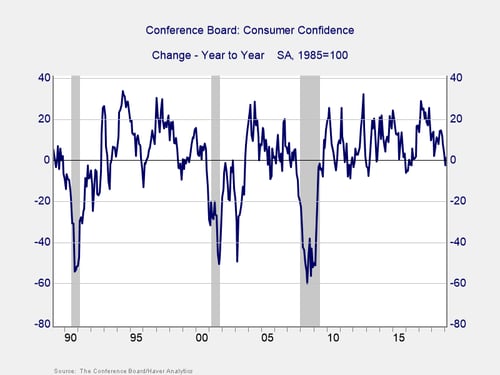
The absolute level of confidence is important, but the annual change is a better indicator of risk. While the level can remain high, when confidence drops significantly (i.e., by 20 points or more) over a year, we have historically seen a recession and a stock market pullback shortly thereafter. We are now just around even on a year-to-year basis, which means another pullback like we saw at the end of last year could take us into the danger zone.
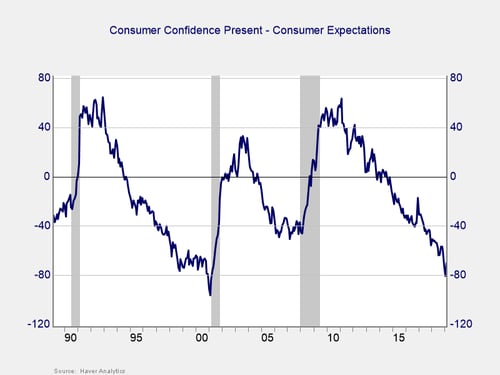
The probability of that decline is also higher than it might seem. One way to measure that is to look at the gap between how confident people are in the present and how confident they are about the future. When that gaps gets very negative, it is a sign of risk (as we see in the chart above). We are now definitely in that risk zone, as future expectations are significantly worse than present confidence. People feel good, but they don’t expect that sentiment to continue—and that can be a catalyst for sudden drops in confidence.
Focus on the similarities
When we look at the past 10 years, then, let’s focus not so much on the differences between then and now. Instead, let’s focus on the similarities between now and the conditions that led to 10 years ago. Conditions are still good, and we should be aware of that. But we should also remember that those conditions can lead to much worse ones—like we saw 10 years ago.


