

 Print
Print “It ain’t what you don’t know that gets you into trouble. It’s what you know for sure that just ain’t so.” — Mark Twain (probably?)
The above quote is a wonderful self-referential example of itself. When I was thinking of it and looked it up, I was quite certain that it was from Mark Twain. But on review, that isn’t certain. So, let’s add this one to the list of things we need to be careful of.
Another emerging candidate for that list is the “fact” that yield curve inversions inevitably lead to recessions. This has been held out by many U.S. economists (including me!) as an indicator that we will have a recession this year. Yet while sentiment clearly pulled back late last year, in no small part because of the predictions from that inversion, the data is still coming in quite strongly. That recession is simply not what we are seeing.
What’s Going On?
When you look at the data from the U.S., of course, you can certainly see that yield curve inversions precede recessions, which is why we have all been so worried. For the past four recessions, we have certainly had a recession, usually within a year or two, of a yield curve inversion. QED. But right now, we are entering the time period when we should expect that recession to show. Yet we see strong job growth, retail sales growth, high confidence, and so on. When you couple that with the fact that the inversion is much deeper than we have seen before, it suggests that (and hear me out here) things might be different this time.
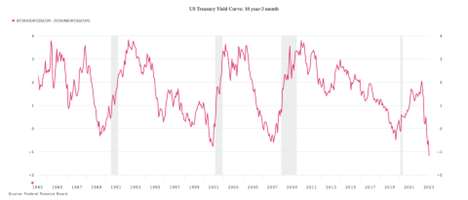
Source: Federal Reserve Board
Are Things Different This Time?
Yes, I know those words are the kiss of death. But even looking at the chart above, we can see that things are indeed different this time. The highest differential between the 10-year and the 3-month yields in this cycle was 2 percent, which is well below the almost 4 percent we saw in all previous cycles. That smaller differential, in turn, was based on the fact that rates were much lower across the board in this cycle than in the past. As such, it was easier to get an inversion—there was a much smaller gap to close—than in any of the previous cycles. It has been different this time with the rates, so it may well be different this time in the consequences. But different how?
I suspect one answer is that it is not inversion that signals the recession but, instead, the absolute magnitude of the decline in the gap. Right now, for instance, that decline is about 3 percent. But, in prior cycles, the decline in the gap was between 4 percent and 4.5 percent. If that is the case, then we can make two predictions.
What Will Happen Next?
The first prediction is that the inversion will continue to widen, down to somewhere below 2 percent, which is much wider than the gap now, already at a record. This could happen as shorter-term rates continue to rise, which would be consistent with more Fed rate hikes. We could also see longer-term yields drop, as fears of a recession intensify. Or, most probably of all, a mix of both. Both of these outcomes are likely, which would support that prediction. The second prediction is that we will not see a recession until the gap gets to that 2+ percent and then reverses. And that will take time, probably several quarters.
If these predictions pan out—and, so far, they are consistent with the data—then we can draw two conclusions. First, a recession is unlikely for the next several quarters. Second, we likely will not get one unless the Fed does keep hiking.
This is good news for us as investors. Right now, earnings are projected to keep increasing this year. And if we don’t get a recession? That increase is more likely. Second, valuations depend on interest rates. Even if the Fed keeps hiking, that may well push longer-term rates down, providing more support for markets.
More Running Room Ahead
While a recession is still possible (indeed, inevitable at some point), it doesn’t look likely anytime soon. That gives us more running room for both the economy and markets. As always, be watchful but not worried. Or, keep calm and carry on.


