

 Print
Print "More than any other time in history, mankind faces a crossroads. One path leads to despair and utter hopelessness. The other, to total extinction. Let us pray we have the wisdom to choose correctly." — Woody Allen
I think the quote above captures much of the commentary around last Friday’s yield curve inversion. For those who are not up to speed, the Fed made a surprisingly dovish statement after its latest meeting, where it essentially put rate increases on hold for the year and noted it would be stopping the drawdown of the balance sheet this year. As a result, markets dropped their expectations for rates—and rates subsequently declined. This decline left the interest rate on 3-month debt above that on 10-year debt, which is the definition of a yield curve inversion.
If you think about it, the fact that you can borrow cheaper for 10 years than for 3 months is a signal that something is broken. It is simply riskier to lend for longer, so the imbalance shows that something is wrong. As such, the yield curve inversion makes sense as a risk indicator.
Empirically, it also works. Historically, an inversion of the yield curve has indeed been followed by a recession and a market downturn, not always in that order. Based on history, all of the doom and gloom makes sense. It may, however, be a bit premature.
A look at previous inversions
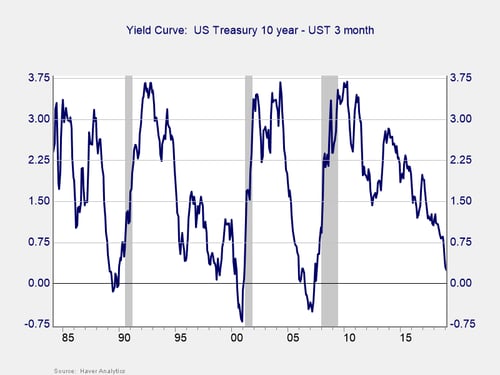
The chart below provides a look at previous inversions. You can see that, typically, an inversion lasts for several months and then un-inverts—at which point we have a recession in a couple of months. Right now, we are at the start of that process, which usually lasts at least six months and often a year or more. In other words, yes, a recession is probably coming, but 2020 looks more likely than 2019.
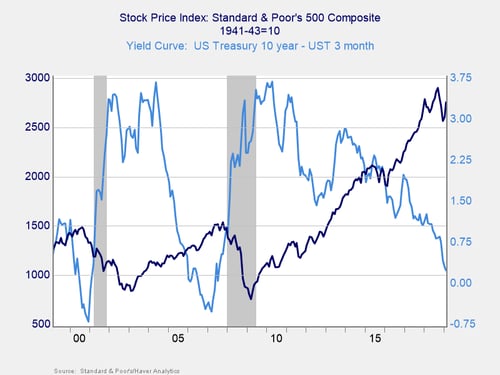
Also worth noting is that the stock market tends to keep rising for some time even after the curve inverts. This pattern makes sense, as an inverted curve means growth is slowing—but not negative. Persistent growth, even at a slower rate, continues to drive up earnings.
No immediate risk (yet)
Based on history and the underlying dynamics of the economy, a yield curve inversion is indeed a bad sign and something to watch. But it is not a sign of imminent doom. What we should take away from last week is the idea that risks continue to rise—and bear watching—but that we very likely still have some time to prepare.
Is this path set in stone, either way? Of course not. We can make a good case that the Fed overreacted on the dovish side and will tighten policy again after the first quarter. These actions would un-invert the curve and likely reset the clock. On the down side, the economy might continue to weaken. If so, the curve could invert further, which would indeed keep the clock running. It could go either way, but in neither case is the risk immediate.
The big immediate risk, from my perspective, is that this is one more piece of news that could shake both consumer and business confidence. That diminished confidence is what could turn a significant but not immediate problem into something more concerning. The news here is somewhat worrisome, in that the consumer confidence data this morning came in quite weak and that was before news of the inversion. This data could be a sign that conditions are weaker than they now seem.
The real message
Even so, however, we still likely have time to watch and prepare. The real message from the inversion is one you have heard before: be watchful, but remain calm and carry on.


