

 Print
Print Yesterday was another bad down day in the markets. Not only that, but other assets are getting hit as well, with bitcoin getting hit even more than the general financial markets. As worries rise, when will the bleeding stop?
Keep an Eye on Rates
As I have written before, it all comes down to valuations, which means it all comes down to interest rates. The higher interest rates go, the lower stock valuations will go. When we look forward, interest rates are what we need to watch. Here, there may be some encouraging news.
Since stocks are long-lived assets (ideally, a company will be around indefinitely), the best proxy for those valuations is longer-term interest rates. Most analysts use the U.S. Treasury 10-year yield as a benchmark. This is illustrated in the chart below, which covers the past 10 years, or roughly the period after the financial crisis to now.
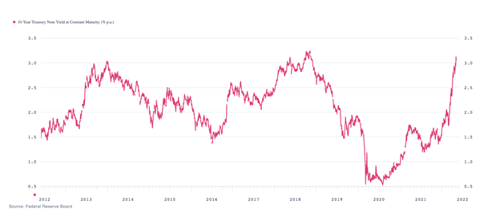
Note a couple of things. First, we have seen two prior periods where the Fed was hiking short-term interest rates and long-term rates responded, in 2013 and 2016–2018. The 2013 increase was by far the faster of the two, with rates going from about 1.75 percent to just over 3 percent; in 2016, we saw rates jump from about 1.5 percent to 2.5 percent, then stabilize before jumping in 2018 from about 2.25 percent to just over 3 percent in 2018. In both cases, we saw rates go from 1.5 percent to just over 3 percent, before stalling and falling back.
This is relevant because that is exactly what has happened this year, with rates spiking from around 1.5 percent to just over 3 percent—just as we have seen two times before. This is the third time this has happened in the past 10 years.
I think those two cases have some useful lessons for where we are right now. In both prior cases, notice, rates peaked and dropped back, as higher rates slowed growth and prompted the Fed to cut again. We are already seeing signs that growth may be slowing this time as well. For interest rates, for example, post-financial crisis the yield on the 10-year has not been able to move sustainably above 3 percent. That suggests that the current interest rate spike may be topping out. Indeed, yesterday saw a bit of a rally in the bond market, suggesting that might be happening.
What About Stock Valuations?
Since we have seen this interest rate scenario before, then, the obvious next question is what happened to stock valuations the last two times this happened? In 2013, as we can see from the second chart below, is nothing much. Valuations were steady at around 14x–16x earnings. But then, in 2018, valuations dropped from 18 times to around 14 times earnings, before rapidly rebounding higher. When interest rates are at this level, valuations seem to be constrained to around 16x–18x. While there may be a short-term drop below that, as we saw in 2018, that drop was followed by a sharp rebound, suggesting that 16 is a sustainable valuation at current interest rates.
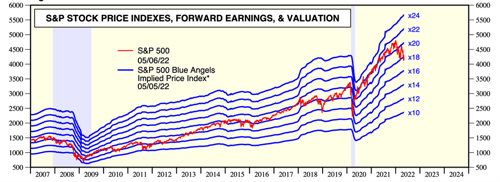
Source: https://www.yardeni.com/pub/peacockfeval.pdf
*Implied stock price index calculated using actual 52-week consensus expected forward earnings times hypothetical forward P/Es. Note: Shaded areas are recessions according to the National Bureau of Economic Research. Source: Standard & Poors and I/B/E/S data by Refinitiv.
What Does This Mean for Us Today?
First, with valuations now in the 16–18 range after the recent market drop, we are likely getting close to done with this pullback. It may have a bit further to go, but again we are now in a reasonable range, and that will provide some cushion to the market. Second, with the economy still growing, we have a fundamental cushion as well. Even if valuations decline a bit further, growing earnings will offset that and limit the damage. There is good reason to believe we may be close to the end of this.
Even if so, though, this has been an unusually scary decline—but why? Two reasons. First, the speed. Rates have spiked—and markets tanked—faster than we have seen in recent years. Second, and this is the major point, markets were overvalued to start, and a bigger adjustment was necessary to get back to something like normal.
In 2018, market valuations adjusted from about 18x at the start to about 14x at the nadir, then ended at about 16x. This year, we started at just under 22x and have dropped to about 17x. This is already a bigger drop than in 2018 and in a much shorter time. A bigger drop, in a short time, is a much scarier experience. Just ask any rollercoaster designer. But, because we have dropped so far, so fast, that may well mean we are closer to the end.
Now, Back to Rates
That takes us back to interest rates. If they keep rising, the damage can and will continue. But if they stabilize, we are now close to the end. Based on recent history, they should be approaching a peak, at least in the short term, and ready to stabilize. That could well give us time to recover. This is what I will be watching going forward.
Is It Time to Panic?
Not at all. This decline, while scary, is still well within what we see in a normal year and, when we look at the underlying data, makes sense. If you are inclined to worry, I would ask if you remember the stock market crash of 2018. If the answer is no (and it is for almost everyone), then I would suggest that a couple of years from now this one will look pretty small in the rearview mirror as well.
Keep calm and carry on.


