

 Print
Print As we move away from the financial crisis and as policies normalize, it is a good time to take a look at what the removal of those policies might mean. After all, many of the actions taken in the aftermath of the crisis were explicitly designed to do certain things. If those actions were successful, then presumably their reversal would have the opposite effect.
Specifically, a Commonwealth advisor asked me about the effect of the Fed’s decision to buy bonds in order to drive interest rates down—known as quantitative easing (QE)—and that is now being reversed, in quantitative tightening (QT). But what does that reversal mean for the market?
First, some context
After the crisis, the Fed wanted to support faster growth, so it cut rates. When that didn’t work how it wanted, the Fed looked for other ways to act. The strategy it chose was to buy hundreds of billions of dollars of bonds. By putting more demand into the system, while the supply of bonds remained relatively constant, the Fed forced prices up—meaning that yields, or interest rates, went down. This was the point of the entire exercise: lower rates make it easier and cheaper to borrow, which can spark economic growth.
So far, so good. But with lower interest rates came a much larger balance sheet at the Fed; it more than quadrupled to a level of trillions of dollars. This was, of course, an emergency measure. Indeed, there were—and are—many worries about the consequences of this explosion of the balance sheet. While none of them have come true, the Fed understandably wants to reduce its holdings to something like normal. As such, it is now slowly allowing its holdings to mature, which over time will reduce them. This is the transition from QE (which built up the balance sheet) to QT (which is reducing it).
What about stock prices?
Indeed, QE did succeed in reducing interest rates. So, QT can reasonably be expected to push them back up, which is arguably just what we are seeing. There is another potential consequence, however, that we should keep an eye on. That is, you could argue that QE also indirectly pushed stock prices up—and that QT could help push them down.
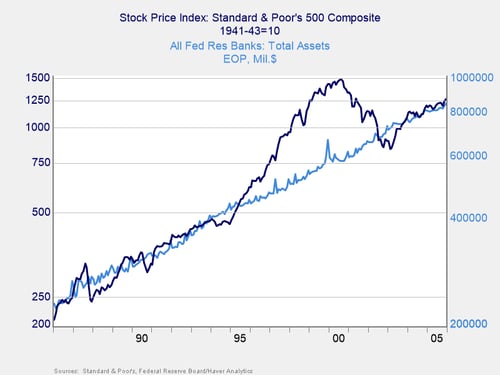
Let’s take a look at why that could be. In the decades leading to the crisis, both the Fed’s assets and the stock market generally rose in tandem. Even the dot-com boom and subsequent bust passed, leaving the two in line. This makes economic sense, as both the stock market and the Fed’s balance sheet are reflections of the underlying economy. They should move in tandem.
A closer look at the boom years
If we take a closer look at the boom years, though, we see that from the late 1990s to 2007, the stock market’s growth stayed well above that of the Fed’s balance sheet. While the Fed kept expanding its holdings in line with the economy, the stock market was growing much faster as valuations kept going higher. The connection of earlier decades was clearly broken. That changed again in 2008–2009, as the stock market collapsed, bringing it back closer to the Fed’s asset base. Based on history, the post-2008 stock market returned to where it should have been.
Given the financial and economic damage the crisis caused, however, and as we stated at the start, the Fed decided to force rates down using QE—buying bonds and expanding its balance sheet. You can see how that spiked in the chart below.
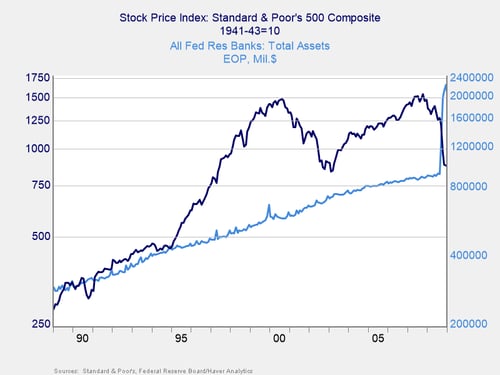
Will the stock market follow the Fed balance sheet?
In the next chart, you can see that, once again, when the Fed pushed its balance sheet up, we saw a match between the growth of the Fed’s balance sheet and that of the stock market. Per history, this is something we could have expected. The problem is the jump in Fed assets that took place with the QE programs. The Fed’s holdings are now much greater, in proportion to the economy, than they have been. The QT program is designed to restore that balance. The question is whether the stock market will then follow the Fed balances down.
The argument that the market will trend down with QT is essentially this: what drove the market higher was the Fed’s program itself. The argument against is that while the initial QE program may have pushed markets higher, since then the growth of the two has been generally in line. Further, while some downward adjustment may be reasonable as the Fed reduces its balance sheet, this adjustment will be limited, just as it was in the 1990s through 2000s.
Also worth noting is that while the Fed is reducing its balance sheet, it won’t be taking the balance sheet back to 2005 levels. The economy has grown since then, and so has the reasonable balance sheet level. Similarly, even if there is an effect on markets, it will not be something that takes us back to levels of the mid-2000s.
A new headwind?
Instead, I suspect this is just one more example of a market tailwind fading and possibly turning into a headwind. It is one more thing to worry about, but not too much. The fact that the Fed can—and is—normalizing may be an indicator that the fundamentals remain reasonably sound. Over time, that will have much more of an effect than the current QT program.


