

 Print
Print The economy seems to be doing well, with job growth still at high levels, consumer spending still healthy, and businesses continuing to invest. But the stock market—which is supposedly a barometer of that economy—is acting very differently. The market has fallen significantly from its peak at the start of the year and, more recently, has taken a sharper drop. What’s going on here, and will it continue?
All About Interest Rates
First of all, the stock market does not directly reflect the economy. There is a link, but what the stock market really tracks are two things: corporate earnings and interest rates. Earnings, of course, grow when the economy grows. So when interest rates are reasonably steady, the market does grow with the economy. Since that is most of the time, that is why we think the market tracks the economy.
Most of the time is not all of the time, however. We are now in one of the times when interest rates are not steady. Over the past couple of months, we have seen rates increase at one of the fastest paces in decades. Thus, even as the economy has done well and earnings continue to grow, those higher interest rates have acted as a headwind and pulled the price investors are willing to pay for those earnings down. It has been a difficult couple of months. And with the Fed publicly committed to continued interest rate hikes, the market clearly is pricing in more headwinds going forward.
Future Damage
But that fact also suggests that the future damage is likely to be limited. Markets already expect—and are pricing in—substantially higher rates. From here, any more damage has to come from interest rates moving even higher than the current substantial increases expected. At some point, that will not happen, as the factors driving those higher rates (i.e., growth and inflation) start to roll over.
We are seeing signs that growth is slowing, for example, and there is talk of a recession in the next year or two. Inflation pressures, while still very real, are starting to weaken as well. Just as markets are pricing in rate increases over the next year, they are also starting to price in rate decreases after that. Any decreases we see will act as a tailwind for stock prices at that time.
Valuation Levels
One way to evaluate where we are, and where we are going, is to look at overall valuation levels, which vary with interest rates. The chart below shows, for example, that between 2016 and 2019, before the pandemic, investors were willing to pay between 16 and 18 times the next year’s expected earnings for the S&P 500. After the start of the pandemic, when interest rates were cut sharply, that jumped up to 20 to 22 times earnings. Since the start of the year, however, as interest rates rose and the Fed committed to even higher rates, valuations dropped to between 18 and 20 times. That explains much of what has happened so far.
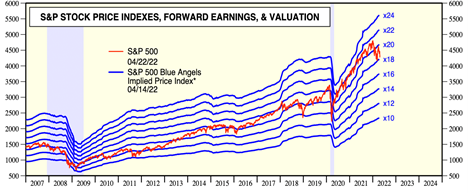
Source: https://www.yardeni.com/pub/peacockfeval.pdf
*Implied stock price index calculated using actual 52-week consensus expected forward earnings times hypothetical forward P/Es. Note: Shaded areas are recessions according to the National Bureau of Economic Research. Source: Standard & Poors and I/B/E/S data by Refinitiv.
What’s Next?
It also gives some guidance about what is coming next. Just as interest rates are expected to return to the pre-pandemic levels, so should valuations. That said, we could see another 10 percent downside, if valuations go back to the lower range of 16 times next year’s earnings. There could be more turbulence ahead in the short term.
Longer term, however, things look better. Earnings will keep growing over time, offsetting any decreases in valuation levels and eventually letting stock prices rise again. At some point—likely in the next year or two—rates will come down again, pushing valuations up. And at that point, we will see stock prices recover surprisingly quickly.
In other words, what we have seen is a typical, if sharper than usual, market cycle. In the short term, it is painful. But in the longer term? It really doesn’t mean much. As long as the economy is basically healthy (which it is) and as long as policymakers are on top of things (which they are), companies will keep growing and making money. We, as investors, will be able to profit from that.
So, Why Is the Market Going Down?
Because the Fed is raising rates to get inflation under control. This is painful in the short term, but necessary to lay the foundation for future growth. As always, we just need to ride out the short-term pain to benefit from that future growth.
Keep calm and carry on.


