

 Print
Print Now that it looks like the coronavirus is starting to come under control (and I will do another update here tomorrow), it is time to think about what is coming next for the markets. We have had the fastest onset of a bear market in history, followed by the fastest recovery into a bull market in history. This kind of volatility is, well, historic. But since it is unprecedented, we can’t really look back at history for guidance as to what happens next.
The technical signs
Still, analysts have tried to do just that. There has been considerable discussion from market technicians, those who look at charts and track price movements, trying to fit recent market action into their models. Most of this discussion has been around the “fact” that what we’re seeing is a normal bounce off the lows, to be followed by a renewed drawdown. Missing from the discussion, however, are the technical reasons for the initial drop, so I am skeptical about their pronouncements. From what I see, the technical signals are bouncing around as wildly as the market itself. Technicals are most useful in the context of longer-term trends, rather than in short-term volatility, which is what we have right now. When you consider the fact that the volatility has been driven by something outside the market itself, technicals become even less useful.
Future expectations: Corporate earnings
More useful, to my mind, is to look at what the market itself is telling us by comparing the recent volatility in stock prices with the expected changes in the underlying fundamentals: corporate earnings. Here, again, we have a problem. That is, we don’t know what earnings will be over the next year or two. But we do have estimates, and we can at least use those as a basis to figure out just how cheap—or expensive—stocks are based on those expectations. That calculation can give us a historical baseline.
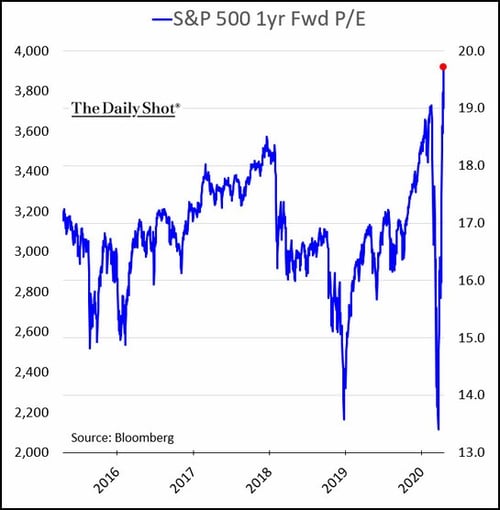
Using that baseline, we can see that when the markets dropped, based on the earnings expectations then, they became the cheapest since 2015. Since then, however, a combination of a market recovery and declining earnings expectations has brought the market to be even more expensive—based on next year’s expected earnings—than it was at the peak earlier this year and more expensive that at any point in the past five years.
Historical data: The Shiller ratio
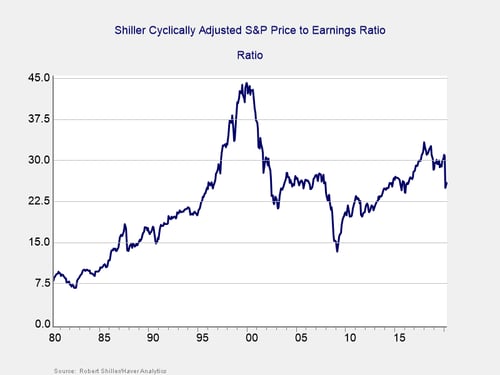
While concerning, the problem here is that this analysis relies on earnings estimates, which can change and are certain to be wrong. To balance that shortcoming, we can also use a different metric that relies only on historical data: the average earnings over the past 10 years rather than estimates of the future. Because it uses averages over a 10-year period, this metric is less influenced by the business cycle or the abnormalities of any one year. It was popularized by economist Robert Shiller and is known as the Shiller ratio.
The chart below (as of the end of March 2020) shows that despite the sharp drop, valuations closed March at about the level of the peak before the financial crisis. As prices have recovered through April, that ratio has moved even higher. Just as the chart on forward earnings showed the market to be very expensive, this one shows the same based on historical data.
So, what did we learn?
Between them, these charts tell us two things based on the fundamentals. From the first chart, even if earnings recover as analysts expect, the market is currently very expensive based on those expectations. For the market to outperform, earnings have to recover even faster. From the second chart, even if that recovery happens, the market still remains very richly priced based on history. In other words, whether you look at the past or the future, right now stocks are not cheap.
Remember, these conclusions assume that the earnings will meet expectations. Right now, earnings growth is expected to resume in the first quarter of next year. For that to happen, the virus will need to have been brought under control; the U.S. and global economy will need to have opened up again; and, this is crucial, American consumers (more than any other) will need to be comfortable going out and spending money like they did in 2019.
All of this could happen, of course, and the first two caveats look reasonably likely to me. The third—consumer willingness to go spend—is the big wild card. Current stock prices depend on all three, but that is the weakest link. Just ask yourself this: in 6 to 12 months, will you be over this?
Volatility ahead?
That is the context we need to think about when we consider what is next. A slower recovery seems more likely, which means we should be cautious about stock prices. There are many assumptions baked into the optimistic analyses, as well as many thing that have to happen between here and there. There are also many potential scary headlines that could knock investor confidence. In the best of all possible worlds, current prices make sense. In a more normal world, we should expect more volatility.
Be cautious. The progress is real, both medical and economic, but markets are saying everything is all right. And while it will be, it isn’t—yet. Keep that in mind.


