

 Print
Print With the market recovery continuing and after the decline at the end of last year, the market is once again moving close to new highs. The multibillion dollar question here is why that is—which hopefully will give us some guidance as to whether it will continue.
The resurgence is especially puzzling as it has come as earnings expectations have pulled back. Earnings surged in 2018, driven by faster economic growth and even more by the tax cuts. But earnings growth is widely expected to revert to lower levels as growth slows around the world and the tax cut effects normalize on an annual basis. With earnings growing slower, you would expect stocks to pull back. Indeed, that was a leading explanation for the drop at the end of last year.
So, where is the bounce coming from?
I suspect the bounce is coming from two main factors. First, against expectations, slower growth has been good for the market. Interest rates have actually gone down, which drives stock valuations up. Second, even as growth has slowed, confidence has rebounded with the end of the government shutdown and on continued strong job growth—and that has also pulled valuations back up.
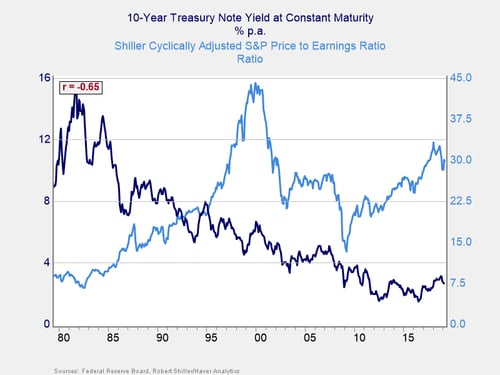
Interest rates. To the first point, in the chart below, you can see a –65% correlation between interest rates and stock valuations. When rates rise, valuations drop; when rates drop back, valuations tend to tick up—which is just what we have seen recently. Rates were rising last year on the faster growth of 2018, which was a headwind to the market, but the recent drop has helped. In that sense, slower growth has moved the economy back into the sweet spot of slower but sustainable growth that the market likes, which has led to the recent bounce. Growth is expected to be slower this year, both here and abroad, which suggests the rising stock market may continue for a while.
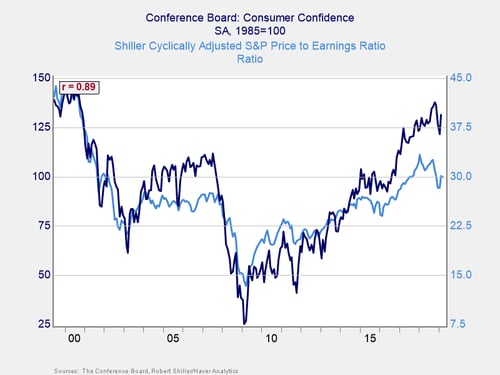
Consumer confidence. In the chart below, you can see a similar relationship—but even stronger—between consumer confidence and stock valuations. Confidence remains extremely high but pulled back sharply at the end of last year before bouncing, just like the stock market. Confidence is largely driven by the jobs market. So here, too, the data suggests the market could well keep rising as long as the job market remains solid.
Will the party continue?
With both of these factors positive and likely to remain so, the current gains may well be extended—potentially for some time. But we need to keep an eye on just how long that might be. We can do so in two ways. The first is to watch the two metrics in question, interest rates and consumer confidence. Those are indeed the key indicators that are likely to determine when the current bull market finally ends. Right now, the news is good. That doesn’t mean that the tree will grow to the sky, however. At some point, economic gravity will reassert itself. The question is, when?
In the chart below, we can see that in the past six years or so, valuations have generally ranged between 14x and 18x forward earnings. The recent dip took us down to the lower end of that range, and we are now at about the middle (i.e., about the recent normal). Looked at this way, the recent pullback and bounce were just noise, and we are now about where we should expect to be.
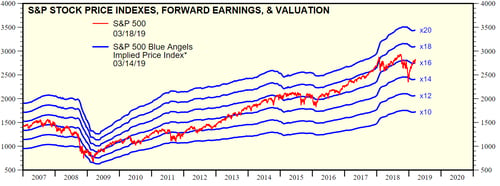
Source: yardeni.com
This level puts a constraint, however, on likely future appreciation. Absent earnings growth, if the market rose another 10 percent to 15 percent, we would be at the upper end of the recent historic range, which is probably a reasonable limit. At that point, it would again become dependent on faster earnings growth.
To answer the question we started with, the recent market pullback and recovery just took us on a round trip within the recent valuation range. As such, current values are likely sustainable, at least for a while. More, we do have some room to the upside (but not all that much). The party may well continue.
Look for the warning signs
We do need to keep watch, however, on earnings for the future and, even more important, on confidence and rates. The real risk is whether valuations shift again, and that will be the best warning sign to watch.


