

 Print
Print With the regular meeting of the Fed underway, we now all wait with bated breath to find out what the decision will be. Well, in this case, there is not much doubt: it will be an increase of 50 bps. But we can still wonder about the wrapping on the present. To shift metaphors and get a bit ahead of ourselves, will Chair Powell come out and see his shadow, signaling six more rate increases? Or will there be sunny skies ahead?
Since it is December—and inflation is still way too high—I doubt very much we will get any sun. So, the question is how much higher the Fed will push rates, not whether it will. Markets are now pricing in 50 bps tomorrow, 50 bps at the next meeting, and then another 25 bps (maybe). If that’s the case, we would have a federal funds rate at or slightly above 5 percent. At that point, we would have to wait and see.
Fed’s View on Inflation
That outcome doesn’t seem unreasonable. But what really matters—and what I will be watching—is the Fed’s view on inflation. When we talk about rate increases, we tend to treat them as existing in and of themselves. In fact, as the Fed and Powell keep telling us, they are a result of the inflation data. So, if the market is correct, what is that telling us about the expected inflation data?
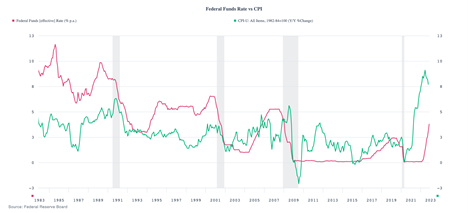
Looking back 40 years, we can see that prior to 2000, the fed funds rate was pretty much always above the CPI figure. That changed in 2000, when the funds rate was below inflation for a couple of years, moved back up, and then changed again in the 2010s, when the fed funds rate was two to four points below the inflation rate for several years. Based on that, the fed funds rate now should be somewhere between 4 percent and 6 percent, if we take the 2010s as our baseline, or around 9 percent to 10 percent if we look to the 1990s. That’s a big range.
The Market-Determined Rate
Arguably, the sustained drop below inflation in the 2000s and post-pandemic was due to a need to help job growth. With employment now close to record levels, the better comparison is probably to the 1990s, which means rates will keep rising for some time to come.
But the fed funds rate, as we know, is determined by the Fed and not by market forces. It is also certainly influenced by employment levels, due to the Fed’s statutory mandate. What if we looked at a market-determined rate instead?
The chart below is more comforting, in that the fed funds rate has typically run below the yield on the 10-year U.S. Treasury note. Rate hiking cycles have typically stopped at or slightly above the 10-year yield, which is where we are now. Per the chart below, which is market-based, we should be close to the end of rate hikes.
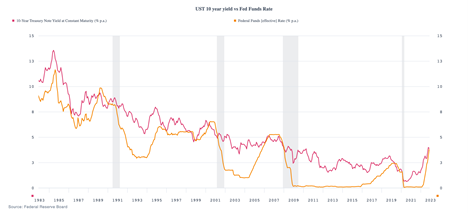
But the only way this makes sense, given the first chart, is if inflation is expected to drop sharply over the next 12 months or so—and that is, in fact, the case. The CPI has come down for the past two months. If the next several months show similar results, which is quite possible, we should see overall inflation drop to around 2 percent to 3 percent by the end of the year. That view seems optimistic, possibly too much so, but that is what the data is saying.
All Eyes on Powell
That will give us the context to evaluate whatever Powell and the Fed say tomorrow. Expect a 50 bp hike and continued hawkish commentary. But watch closely Powell’s response to the most recent data and any comments he makes about U.S. debt markets. That will be the best indicator of the fed funds rate going forward.
Right now, the yield on the 10-year (at around 3.5 percent as I write this) is signaling inflation should be down to between 2 percent and 3 percent by the end of the year, which, as noted, is consistent with market expectations. If that is the case, then the fed funds rate will, based on past behavior, be constrained to a maximum of around 5 percent, even if we move back to the spreads we saw in the 1990s. Even if we move to a more historically normal monetary policy stance, the inflation data and the Fed’s historical performance show that the fed funds rate will likely peak early next year.
That will be the key thing to watch: whether the Fed signals it is close to the peak. I doubt it, as Powell wants there to be no doubt about the Fed’s determination to bring inflation down. Even if it does not, we can learn a lot by watching the 10-year Treasury yield because the Fed certainly is as well, even if it does not say so.


