

 Print
Print I found a really interesting chart in my e-mail this morning. I think its implications extend well beyond what it actually shows, and so I thought it worth sharing. The chart is below, but the full version and discussion can be found on howmuch.net.
Look beyond the surface
On the surface, this chart is about how much prices have changed in different categories over the past 20 years. You can see that average hourly earnings are up about 75 percent, and the average consumer price level is up by just over 50 percent. On the face of it, these figures suggest that the average worker has actually increased his or her purchasing power over that time period. So far, so good.
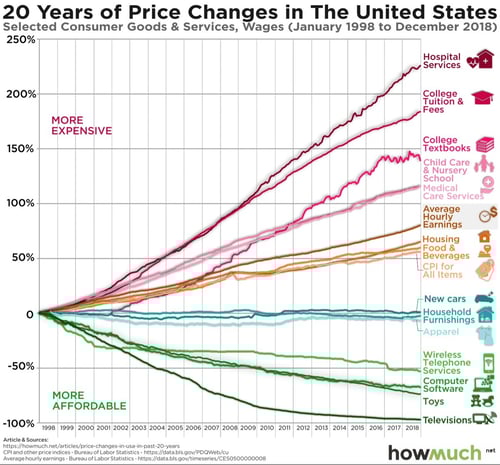
When you look at the different categories of spending, however, some big trends emerge. Manufactured goods are flat or down significantly. Electronics and computers, for example, are down by 50 percent or more, while apparel, furniture, and cars are at about the same prices. In other words, anything that could be made at scale outside the U.S. got cheaper or stayed the same.
Goods and services that didn’t fit either of those criteria—scale or “globalizability” (to coin a word)—went up in price, by a lot. Medical costs, education, child care, and housing—none of those can be outsourced to lower-wage countries or be done at anything like the scale that manufacturing can.
What really saved the average worker, whose income went up by 75 percent, then, was the scalability and globalizability of much of what he or she buys. If manufactured goods had increased in price by nearly as much as everything else, the cost of living would be much higher, especially when compared with how much the average person’s purchasing power has risen. We would all be much poorer.
The costs and benefits of trade
This model explains many things. First, it sheds light on why such a big deal is made of electronics and why people buy so much. Yes, electronics can be entertaining, but they are also affordable to most people. Second, it shows why housing gave us a global crisis and is now looking to become an economic headwind again.
Third, and perhaps most important, it illustrates how the current trade situation developed and why. Companies didn’t outsource production to China out of hatred for the American worker but because they had to, in order to produce things the American consumer could afford. They succeeded, and it’s good they did, as you can see above. The ability and willingness to go outside the U.S. certainly had costs, but it also had real benefits.
Those benefits are easy to take for granted, which is what drives much of the current commentary about trade deficits and trade wars. The fundamental idea behind a trade war is that somehow the current situation happened because one country took advantage of another. That is not the case. For both countries, there is a mix of benefits and costs. Here in the U.S., the costs included lost jobs for everyone. But the benefits included cheaper goods and a more affordable standard of living for everyone.
Reduce costs, reduce benefits
We can certainly try to reduce the costs. But when we do so, we must keep in mind that we will likely be reducing the benefits as well. You might well say you are willing to pay more for a TV to bring good jobs back here. But are you willing to pay more for everything—including mortgage rates, housing, and so forth? And are you willing to have everyone else pay more, including those who can least afford to do so?
It’s never as simple as that. The chart above does an excellent job of showing why that is.


