

 Print
Print This week, we have been talking about interest rates and the Fed—and what that all likely means for our investments going forward. But behind those conversations is another more fundamental question: what should interest rates be? If there is some natural rate where interest rates should be, that could give us some guidance as to where they will end up. That is really what we should be looking for as we plan our portfolios over the long term.
Defining the Terms
Before we get to that, let’s define our terms a bit. When we talk about interest rates, we are usually talking about something we see in the market, whether a mortgage rate or the yield on a bond. Those, however, are nominal rates—they reflect a combination of the current real interest rates and inflation. As inflation changes, so do the nominal rates. Real rates, however, should at least, in theory, be less variable as they reflect the underlying real economic factors, such as demographics and capital demand. To get an idea of what interest rates should be, this is the layer we need to concentrate on.
How Do We Get Real Rates?
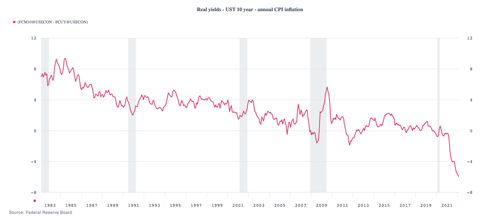
One way to get real rates is to look at the yield on 10-year U.S. Treasuries and subtract inflation. Looking at the chart below, which covers the past 40 years, we can see that from the late 1980s through about 2000, real rates were around 3 percent to 4 percent. In the 2000s, pre-financial crisis, real rates were roughly between 1 percent and 3 percent. And in the 2010s, real rates were between 0 percent and 2 percent, but mostly between 0 percent and 1 percent in the years before the pandemic.
This gives us the context for most of the interest rate discussion over the past decade. It explains why economists (me included) widely expected rates to go back to “normal” levels of 3 percent to 4 percent after 2000. It explains why economists expected rates to go back to “normal” levels of between 2 percent and 3 percent in the 2010s. And it explains why economists expect rates to go back up now. Given this history, you would expect those expectations to, once more, go unfulfilled.
Will Real Rates Rise?
The chart also shows there are good reasons, both economic and historical, to expect rates to rise this time, potentially significantly. Note that real rates only dropped below zero two times in the past 40 years, in 2008 and 2011 (both times of systemic crisis). In both cases, real rates then bounced back above zero within a year. Based on that, we should expect real rates to rise above zero again sometime in the next year or so.
But the other thing to take from the chart is that rates have to increase by much more this time to get above zero. Real rates are now at almost –6 percent, well below the previous bottom of –2 percent. Not only is the gap greater, but so is the economic urgency to move back to a more normal level of real rates. This, in turn, explains why the Fed is being very clear that it expects to keep raising rates over at least the rest of this year.
So, What’s the Problem?
But the Fed has a problem here. Yes, it is raising rates and will keep doing so. But the plan, as announced, will not solve the problem. If we get seven more rate hikes, as markets seem to be expecting, plus the one we just had, that is two of the six percentage points we need to get back to zero. More has to be done. Which leaves three possibilities.
One is that the Fed hikes faster and longer than markets now expect. This is certainly a possibility. But based on what it has announced so far and on market expectations, this is not what the Fed is looking for. The second possibility is that it takes other policy action that will drive rates higher—and this is the quantitative tightening (i.e., the reduction in Fed purchases of bonds) that was also teased in the most recent meeting statement. This could contribute another point or two of higher rates and will help close the gap.
The rest of the solution is likely to come from a decline in inflation, or so both the Fed and markets hope. If inflation closes the year down a couple of points from where it is now, which is quite possible, then that combined with Fed rate hikes and tightening would get us back to or close to zero. We can get there, but the exact path remains uncertain.
This is what both the Fed and markets will be watching over the rest of the year. Rate hikes are certain, quantitative tightening almost so, and lower inflation likely. Exact policy changes and outcomes will be data-dependent, as the more inflation declines, the less the Fed has to tighten policy, and vice versa. When you read the headlines, this is what you need to watch.
Back to Zero?
As for the end state, zero real interest rates are of course not where we want to be. Real rates should be, and from an economic perspective have to be, positive. By how much is up in the air, but looking at the 2010s, around 1 percent seems to be a reasonable minimum. So, the progress back to zero is just a start. It is, however, a necessary start and will define policy for the next several quarters.
The Big Picture
For the rest of the year, we can reasonably conclude that we will have interest rate hikes of at least two points. Quantitative tighten should get started in the next meeting or two. And if inflation doesn’t start to roll over, expect the Fed to signal an even more restrictive policy ahead.
Big picture? All of that means that what the Fed said at the last meeting, it means. Look to see six or seven more rate hikes by year-end.


