

 Print
Print We’ve talked a lot about higher interest rates and what they mean for the market. But we haven’t really looked at what is driving those higher interest rates, which is inflation. Of course, you see the stats and the headlines, but as usual, there is very little context or explanation as to what those numbers mean. Today, I want to take a look at what inflation actually is.
What’s Included?
The definition of inflation is not that complicated: a general increase in prices and a fall in the purchasing value of money. The definition includes the two factors that people worry about, which are, in essence, the same thing. Money is worth less compared to things, so it costs more money (prices increase) to buy the same number of things. But what it does not specify is what things are being bought, and that makes a big difference.
As an example, two of the most commonly quoted inflation figures—the headline number and the core number—differ in that the headline number includes energy and food, while the core number does not. For anyone who eats, who drives a car, or who heats their residence, the core number would seem to be beside the point. So, when we talk about inflation, we need to make sure what prices are included and then decide how relevant they are to our lives.
The Standard Measures
This brings us to the standard measures of inflation. The Consumer Price Index, the best known of the inflation numbers, is based on the spending mix shown below. So when we talk about inflation, we are essentially talking about housing (42 percent), transportation (18 percent), and food and beverages (14 percent). These three categories make up almost three-quarters of inflation. The reason for this, of course, is that these three categories also make up the majority of spending for most people. Between rent/mortgage, car payments and gas, and food, that accounts for the bulk of most people’s budgets. And that is why the weights are what they are, to reflect how most people spend their money.
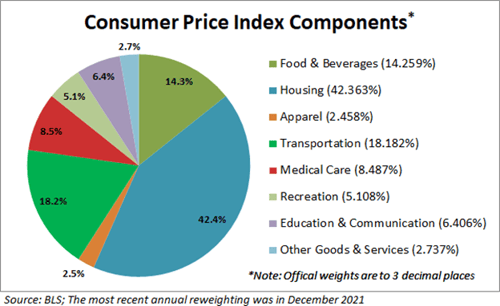
Source: Advisor Perspectives
Note that this doesn’t even attempt to reflect everyone’s experience. If you have a fixed-rate mortgage, your housing costs will stay more stable than the inflation numbers suggest. If you have an electric car, your transportation costs will be less when gas prices increase. And if you eat only at home, you will not be affected by restaurant price increases. This is an unavoidably imperfect measure. But, as a standard, it does reflect an average-ish person and, most importantly, gives us a standard means of comparison.
So let’s use it that way. When we talk about the high inflation we have seen recently, as we determined above, we need to look at three things: housing, transportation, and food. In all three cases, we see sustained price increases. So far, so good. The numbers make sense and are consistent with our real-world experience. But when we look forward, we have to consider whether those trends will continue.
A Look at the Trends
Here, looking at history can be helpful. Looking at the trends by sector since 2000, we can see that housing for the most part has shown steady moderate increases, although it spiked a bit in 2009 and starting in 2021. Similarly, food and beverages has shown more modest increases, but here again we saw faster gains from 2021 on. Finally, transportation was largely flat from 2008 through 2020, only to spike much more sharply in 2021. In all three cases, inflation took off starting in 2021.
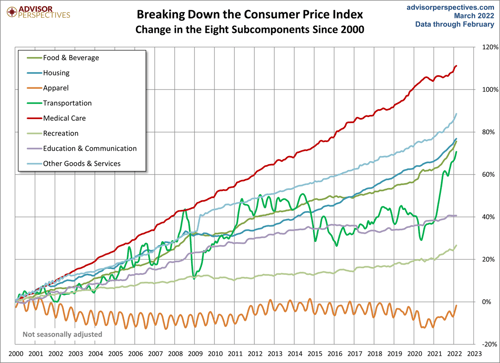
Source: Advisor Perspectives
Given the timing, it is hard to escape the conclusion that the significant rise in inflation was due to the collision of more demand as economies reopened with the supply chain damage from the pandemic. Given that much of this comes from the pandemic, as the pandemic fades, we should also see inflation start to move back down as demand and supply chains normalize. And that was indeed what we were starting to see in many areas—but now the Ukraine war has introduced a whole new set of supply constraints.
A Move Back to Normal?
Looking back, then, the inflation we have seen so far has been largely due to the pandemic. If we could move back toward normal, it would subside. Unfortunately, it will be some time before we can do that, and inflation looks likely to continue for a while. So let’s talk tomorrow about what the inflation prospects are in the future.


