

 Print
Print One of the big themes so far this year has been the return of volatility to the stock market. After a very calm 2017, markets have gotten much more turbulent in 2018. One way to quantify this is to look at daily movements. In 2018 (through April 9), the S&P 500 had an intraday swing of 2 percent or more on 13 days. The day-to-day price movements, measured at the close, have been more than ±2 percent on eight days. Neither of those happened in 2017, at all. There clearly has been an increase in volatility, and in a big way.
What does this mean? The answer isn't clear. Trends take a while to develop and then change—and a couple of months of volatility, even after a year of calm, isn’t necessarily reason to worry much. What we can do, however, is look back at history to see if there have been any similar periods.
The VIX
Over a long period of time, looking at daily changes is difficult. Instead, let’s look at the market volatility index known as the VIX (formally the Chicago Board Options Exchange Volatility Index). The VIX uses the prices of options to derive how much volatility the market is pricing in, and it is a good measure of how investors as a whole perceive the risk built into the markets. It tends to spike when the market drops and is therefore popularly referred to as a “fear” index. But it really is just what it says: an index of volatility. It's just that no one minds upside volatility, so the downside risk gets the attention.
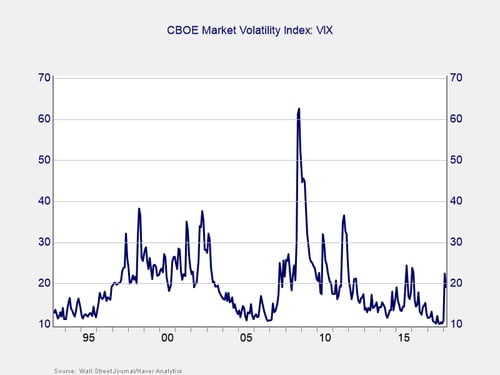
One of the narratives about 2017 was that the low volatility—the market calm—was unprecedented. Similarly, the recent spike is being cast as somehow unprecedented. Looking at the chart above, however, we can see that 2017, while quite low, was hardly unique. In fact, we saw similarly low levels of volatility in 2005–2006 and 1995–1997. Further, the recent spike has just put us at levels we saw in late 2015–2016 and well below the levels of 2011 or the early 2000s (not to mention 2008–2009, which is in a class by itself).
What can we learn?
So, the immediate and recent past volatility levels are things we have seen before, and we can learn from them. Volatility, for example, tends to drop through a sustained bull market, as we saw in the early 1990s and the mid-2000s. That makes sense, as the economy expands steadily during these periods, company profits rise, and investors gradually get more and more comfortable. This makes them less likely to react and move the market around, even on bad news. In that sense, the low levels of the VIX in 2017 were the end of a natural decline over previous years—very like what we saw in 2005–2006. Similarly, when investors get too comfortable and then something happens to wake them up, volatility tends to spike up, as we saw in previous periods.
Where are we now?
The markets appear to be recovering. But is the worry over? History suggests we may not be out of the woods just yet. Previous spikes in volatility have lasted for months, not days, so we may yet see more turbulence.
As for deeper damage, it remains possible. But here the news may be more encouraging. While we saw extended volatility in 2015–2016, and even in 2011, markets in the end did not fall much further than we have already seen. Volatility does not equate to a bear market, although it can be a prelude to one.
Right now, while volatility is high—and likely to remain so, at least for a while—the market is still supported by the economy. Other supports include likely share buybacks by companies in coming months, as well as rising earnings. Another positive factor is that much of the recent turbulence has come from geopolitical concerns, rather than economic ones. The ingredients that go to make a bigger drawdown simply are not there, yet.
Keep calm and carry on
So, expect more volatility ahead. Given the positive fundamentals, however, don’t take it for more than it is. There will be reasons and a time to worry, but the data says we are not there yet. When the fundamentals weaken, that will be a time for concern, which we will keep monitoring here with the monthly economic risk update. For now, keep calm and carry on.


