

 Print
Print Brad here. Today's post features a dive into second-quarter earnings season. It was written by Jim McAllister, director, equity research, on our Investment Management and Research team. Take it away, Jim.
Earnings season tends to generate a lot of headlines at both the individual stock level and the broad index level. During this most recent earnings season, those headlines have been telling conflicting stories. On the positive side, we have heard that the vast majority of companies in the S&P 500 are beating earnings expectations. But other sources are more bearish, claiming the S&P 500 has officially entered an earnings recession. What’s really going on?
Are corporate earnings really beating expectations?
The answer to this question depends on your definition of “expectations.” While this may sound like a textbook political response, it is relevant because expectations change over time.
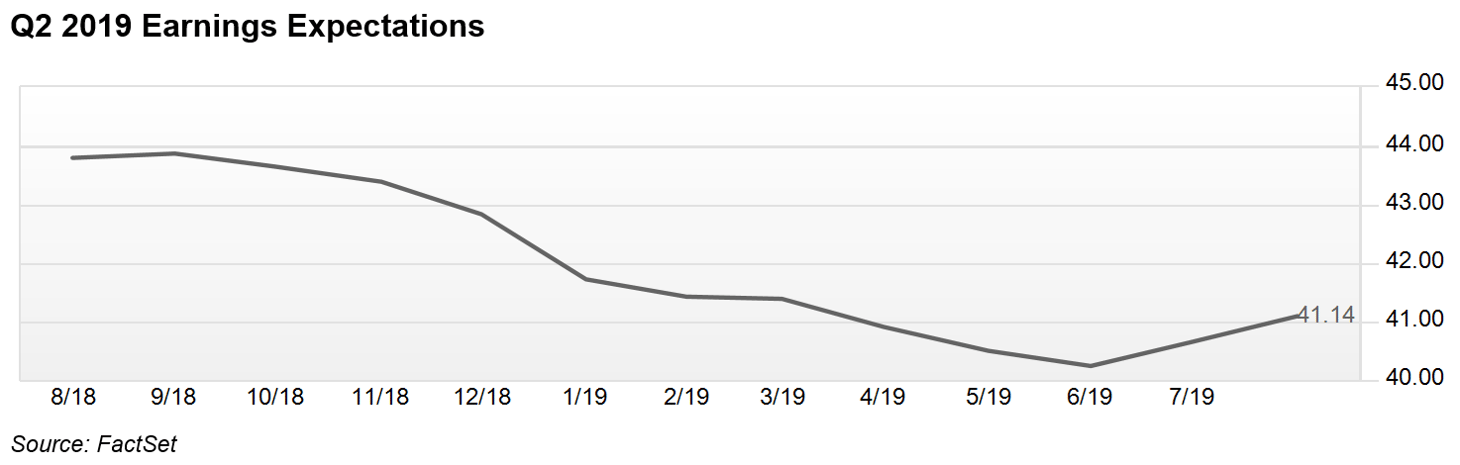
For example, as you can see in the below graph, S&P 500 earnings expectations for the most recent quarter started the year at $42.86 and dipped to a low of $40.29 at the end of the second quarter. Over that six-month period, analysts lowered their estimates by 6 percent. Some of the reduction was justifiable, coming as it did on the heels of lower global economic growth and the negative impact from the tariffs. It has, however, become a common occurrence for analysts to set their expectations artificially low at the end of the quarter, especially on buy-rated stocks.
Most investors don’t catch wind of the negative earnings revisions leading into quarter-end, so there is typically no impact on the underlying stock or the market overall. But that lowered bar allows for a larger percentage of companies to beat expectations—a data point that is much more frequently reported in the press and by market data providers. This one-sided practice fuels a largely false narrative that not only are corporate earnings better than expected, but future expectations could be revised higher as well.
We can see that second-quarter results for the S&P 500 are at $41.14 to date, almost exactly where expectations stood at the start of the quarter but well below where they were at the start of 2019. Yet strategists, analysts, and media bulls alike can point to the “fact” that 75 percent of companies are beating expectations as a reason for the market to keep trending higher. Unfortunately, this short-term view causes a lot of investors to miss the forest for the trees.
What about the supposed earnings recession?
The other major earnings-related headline we’ve seen recently is that the S&P 500 has entered an earnings recession, which is defined as two consecutive quarters of negative year-over-year earnings growth. Brad addressed this topic back in mid-July, before earnings season had really hit its stride. But now that 90 percent of companies in the S&P 500 have reported (as of August 9, 2019), we have more detailed results from which to draw conclusions. And the fact is the conclusion from that blog post has not changed all that much: there is no consensus that an earnings recession has occurred, and even if there were, it is not a reason to be fearful.
Most sources that we use for earnings results, most notably Standard & Poor’s itself, do not show negative earnings growth in either the first or second quarters of 2019, which makes the recession argument moot. Even sources that do cite year-over-year declines show declines of less than 1 percent in both the first and second quarters. Technically, by definition, one could say this is an earnings recession. But is that in and of itself something to worry about?
We don’t think so. And that’s because, over the long term, equity prices are highly correlated with earnings. This would suggest that even if we were to see a slight decline in earnings growth year-over-year, it shouldn’t result in a large pullback in equity prices, assuming the long-term fundamentals remain positive—and they do.
Sure, there can be disconnects between earnings and stock prices in the short term, often driven by headlines seeking to spur fear or euphoria. We saw this happen at the end of last year, when the market pulled back almost 20 percent on fears of slower growth and trade wars. It didn’t take long for the fear to subside, as investors realized those short-term concerns were unfounded. And despite another bout of volatility recently, with earnings growth expected to be flat to slightly positive through 2020, the long-term fundamental backdrop for equities remains positive.


