

 Print
Print I had planned to post my monthly Economic Risk Factor Update today, but that will have to wait until next week. Spoiler alert: Conditions remain favorable, but the jobs report issued today was a big surprise and merits some detailed consideration.
The good news . . .
Lots more jobs were created in January than expected. The most inclusive measure, nonfarm payrolls, was up by 227,000, compared with 157,000 in December and well above expectations for 180,000. This is a big number—and something of a shock, as job growth had been slowing down.
Viewed on a year-to-year basis, though, it is less impressive, with annual growth continuing to trend down.
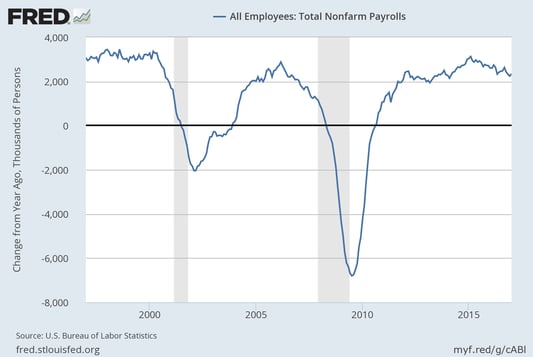
Last month, a reader asked whether that slowing was a bad sign; after all, at some point in the cycle, won't we simply run out of workers? My response at the time was yes, and we seemed to be seeing signs of that.
When we dig into the details of this month's strong report, that late-cycle slowing still looks pretty likely.
- The employment cycle has reached the point at which businesses are starting to hire warm bodies, for lack of better candidates.
- The labor force participation rate rose again, to 62.9 percent, as companies expanded their hiring criteria.
- Wage growth ticked back down, from 0.4 percent to 0.1 percent, as lower-wage hires predominated.
- Unemployment and underemployment rates rose as more people moved back into the labor market on the expectation that they could get jobs.
Make no mistake, the surge in job creation is unmixed good news, particularly for those who now are able to get jobs but perhaps could not before. Continued job growth and wage growth, especially for people moving back into the labor force, will be good for them and good for the economy as a whole.
And the less encouraging news
In the longer term, though, the details above suggest that we are moving closer and closer to the end of the cycle, and faster job growth will just get us there sooner. Looking at the chart again, we can see that job growth in the mid-2000s was above 2 million on a trailing 12-month basis for two years before exhausting the labor supply.
Ten years later, with baby boomers retiring, we are now at the end of five-plus years at the same high level of job creation. Granted, we started from a pretty deep hole, but the fact is, we passed the previous 2007 job level in May 2014.
When job growth drops below about 2 million, a recession is usually a year or so away. This month’s strong report keeps us above that risk level, but it doesn’t change the downward trend closing in on it. This is something we have to keep an eye on. You’ll likely hear a great deal of commentary about this report—good, bad, and indifferent. Although it is good for the economy, and for workers, it signals that the recovery is getting pretty old.
What does this mean for us as investors?
Despite the good news for the economy (in fact, because of it), recent signs of higher inflation are likely to keep popping up. The Fed is likely to continue to raise interest rates. Corporate profit margins are likely to come down as companies are forced to pay workers more. And, at some point, we will see a correction. Keep that in mind as we celebrate today's good news.


