 Every so often, you read something that makes so much sense you wonder why you didn’t write it yourself. Recently, I have run into a couple of articles I wish I had written, and I’d like to highlight them with some additional thoughts.
GDP data: Scratching below the surface
The first, on GDP growth, comes from the evocatively named Urban Carmel, from his blog The Fat Pitch. I have written before about how we can draw very different conclusions depending on how we look at data. Mr. Carmel has done a wonderful job breaking out how, in fact, the recent GDP report is actually much better than it looks on the surface.
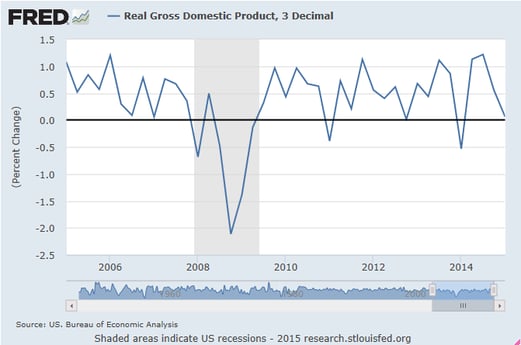
To summarize, the following chart, which shows the percentage change in GDP quarter on quarter, is what we’re hearing about in the press. And, frankly, it looks bad.

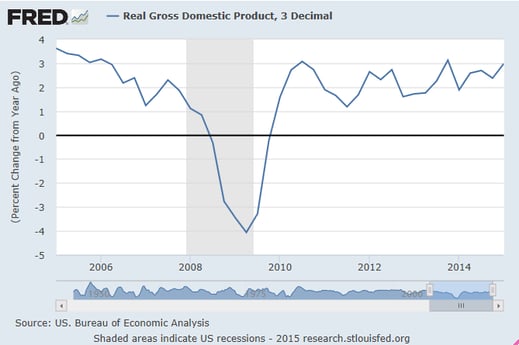
But if you look at GDP growth over the previous year, which is illustrated in the next chart, you can clearly see that growth has both increased over the past three years—and is approaching precrisis levels of 2006 and 2007. Both ways of looking at the data are valid, but using a longer-term analysis, rather than one highly variable data point, gives a much better picture of the results that matter.

I’ve been expressing this same sentiment in many ways, using different data, but this is an excellent illustration of exactly why I remain optimistic about the economy. Thank you, Mr. Carmel!
Wage growth: The effect of shadow labor supply
The second article that caught my attention came in an e-mail from the not nearly so evocatively named firm of Morgan Stanley. It included a graph that presented a very simple but useful characterization of the shadow labor supply.
The shadow labor supply refers to an ongoing debate about whether the declining labor participation rate is a structural change (i.e., the workers are gone for good) or a cyclical change (i.e., they might come back). This matters because if there are a lot of extra workers out there who are unaccounted for, wage growth will be depressed, which is what we have seen. How many excess workers there are will determine when—and whether—wages start to increase at a faster rate. It’s an important question.
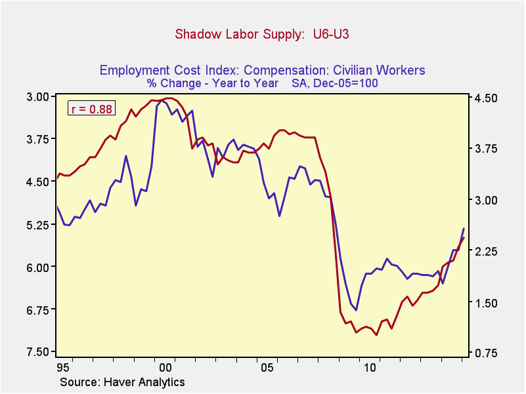
What the folks at Morgan Stanley did was to simply subtract the headline unemployment rate from the more inclusive underemployment rate (which includes those discouraged workers). They then compared that with growth in the employment cost index, which measures total wage and compensation costs. Below is a recreation of this graph.

As you can see, the difference between the underemployment rate and the unemployment rate is very consistent with the growth in employee compensation. This simple fact strongly suggests that the excess labor supply, which would indeed hold down compensation increases, is pretty well captured by that difference. This graph is a very reasonable negative response to those who say there is a vast reserve of discouraged workers not captured by existing statistics. Moreover, if employment continues to increase—and I believe it will—then we can expect worker compensation to increase as well, thus suggesting that another outstanding problem is on its way to being solved.
Thank you, Morgan Stanley! Overall, a very useful and enlightening analysis.


 Print
Print

