The Independent Market Observer

5/22/13 – More About Future Growth

May 22, 2013

In yesterday’s post, I wrote that higher costs will result in lower growth. We also have other reasons to be concerned that future growth rates won’t match those of the past—with significant impacts on investing.

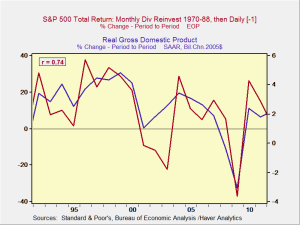
Here’s the short version: lower future economic growth is very likely to result in lower future stock returns. I’ll get into the details below, but one chart makes the case quite clearly.

Continue reading → Leave a comment

5/14/13 – A More Cheerful Look at Stock Valuations

May 14, 2013

One of the keys to looking at the stock market as a whole is valuations. For a given stream of earnings, how much you pay can make the difference between success and failure. Much like buying a car, getting a great deal goes a long way toward being happy with the results.

Continue reading → Leave a comment

5/13/13 – Thinking About an Exit

May 13, 2013

Last week, I mentioned that just because the Fed wasn’t talking about an exit strategy didn’t mean it wasn’t thinking about one. Sometimes you get lucky—on Saturday, the Wall Street Journal ran with an article on just that.

As the paper reported, Fed decision makers don’t know exactly how they will exit, as it will depend on the circumstances, but they’re now pondering it. To some extent, this puts paid to the notion that we’re doomed to continue on our present path until everything melts down. Yes, the Fed will exit at the appropriate time, even as the economy continues to improve on its own.

Continue reading → Leave a comment

4/29/13 – Demography Is Destiny

April 29, 2013

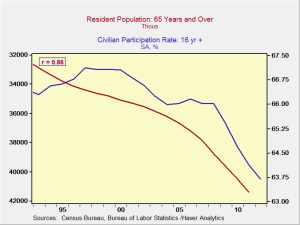
Over the past year, I’ve written about a number of issues that touch on demography, explicitly invoking it in discussions of employment and future growth. Like the group of blind men examining the elephant, however, I haven’t really considered the thing as a whole.

Demography, the study of the structure and characteristics of human populations, is almost unique in the economic universe in being something we can forecast with a great degree of certainty. We know, for example, how many people were born in 1965—that won’t change once the year is over—and we have a very good estimate of how many have died or had children since then. Unlike, say, employment, demography evolves over decades in a predictable way.

Continue reading → Leave a comment

4/24/13 – Predicting the Stock Market

April 24, 2013

Is it possible to predict the stock market? As usual, it depends on what you mean. If you mean determining where the market will close today or tomorrow, or what a particular stock will do next week, the answer is no. It’s when you get into longer time frames, or larger portfolios, that things get interesting.

It also depends on what you mean by “predicting.” Are you, for example, looking at calling an exact number or just seeking an idea of likely outcomes? If the former, you’re out of luck; if the latter, you can probably make some headway.

Continue reading → Leave a comment

4/23/13 – What Is the U.S. Spending Money On? (Part 2)

April 23, 2013

Yesterday, we talked about how the opportunity cost of not spending on defense might in the end be greater than the spending. Today, I’d like to do the same for social security.

I don’t believe the case for spending is clear here, and I’m mindful of the weakness in the opportunity cost argument. After all, if I bought all of the great deals I get in my e-mail every day, I would be bankrupted by the savings. But that’s a different post.

Continue reading → Leave a comment

4/17/13 – Uncertainty, Precision, and Accuracy

April 17, 2013

On the heels of yesterday’s post on risk, outliers, and uncertainty, I saw an interesting article today in the New York Times. It discusses a recent paper highlighting potential errors in the work of Carmen Reinhart and Kenneth Rogoff, authors of the influential 2010 economic study “Growth in a Time of Debt” and the book This Time Is Different.

Covering financial crises in many countries over the past several centuries, Reinhart and Rogoff’s (RR) massive study draws the conclusion—controversial in certain circles—that, when a country’s overall debt exceeds a certain level with respect to the size of the country’s economy, expressed as GDP, future growth declines. It is used as an argument against excessive government spending and debt, particularly here in the U.S.

Continue reading → Leave a comment

4/11/13 – Chained CPI and Means Testing

April 11, 2013

We will be hearing quite a bit about the Chained Consumer Price Index (chained CPI) over the next couple days, though most of the details don’t matter. It’s the first of two major takeaways from the president’s proposed budget.

For the sake of completeness, here’s the definition of chained CPI. What matters for the average citizen, however, is one thing: chained CPI increases more slowly than the inflation measures that are currently used, the CPI-U (the CPI for All Urban Workers) and CPI-W (the CPI for All Urban Wage Earners and Clerical Workers). By shifting the measure used, payments for social security will increase more slowly over time.

Continue reading → Leave a comment

3/19/13 – Taxes, as Simple as That

March 19, 2013

I’m still in New Orleans, but I wanted to expand on a response I wrote to a question posed by Faye Casey as a comment on an earlier post. It addresses, directly and indirectly, many of the issues we now face in Washington, D.C. The question was, “If we were to eliminate many of the loopholes in our taxation system, would it not be possible to have lower rates? Seems to me that’s what I’ve been reading lately.”

First of all, thank you, Faye. This is a very good question, and it raises a number of issues that speak not only to the tax problem but to every problem we have in Washington.

Continue reading → Leave a comment

3/13/13 – Where Do Record Stock Prices Come From? Part 2: Earnings Per Share

March 13, 2013

In yesterday’s post about revenue growth and profit margins, we talked about how the significant tailwinds that have benefited the markets over the past couple of years may well be playing out. With that in mind, if company earnings are looking to—at best—grow at significantly slower rates than they have over the past couple of years, does that mean similar results for the stock market?

Not necessarily. Stock prices are based on shares, not companies. The relevant metric, therefore, is earnings per share (EPS), not company earnings. The two are obviously connected; however, while company earnings growth may slow, EPS growth doesn’t have to lag to the same extent.

Continue reading → Leave a comment

Subscribe via Email

Crash-Test Investing

Hot Topics


New Call-to-action

Conversations

Archives

see all

Subscribe


Disclosure

The information on this website is intended for informational/educational purposes only and should not be construed as investment advice, a solicitation, or a recommendation to buy or sell any security or investment product. Please contact your financial professional for more information specific to your situation.

Certain sections of this commentary contain forward-looking statements that are based on our reasonable expectations, estimates, projections, and assumptions. Forward-looking statements are not guarantees of future performance and involve certain risks and uncertainties, which are difficult to predict. Past performance is not indicative of future results. Diversification does not assure a profit or protect against loss in declining markets.

The S&P 500 Index is a broad-based measurement of changes in stock market conditions based on the average performance of 500 widely held common stocks. All indices are unmanaged and investors cannot invest directly in an index.

The MSCI EAFE (Europe, Australia, Far East) Index is a free float‐adjusted market capitalization index that is designed to measure the equity market performance of developed markets, excluding the U.S. and Canada. The MSCI EAFE Index consists of 21 developed market country indices.

One basis point (bp) is equal to 1/100th of 1 percent, or 0.01 percent.

The VIX (CBOE Volatility Index) measures the market’s expectation of 30-day volatility across a wide range of S&P 500 options.

The forward price-to-earnings (P/E) ratio divides the current share price of the index by its estimated future earnings.

Third-party links are provided to you as a courtesy. We make no representation as to the completeness or accuracy of information provided on these websites. Information on such sites, including third-party links contained within, should not be construed as an endorsement or adoption by Commonwealth of any kind. You should consult with a financial advisor regarding your specific situation.

Member FINRASIPC

Please review our Terms of Use

Commonwealth Financial Network®