The Independent Market Observer

5/2/14 – Employment Report Points to More Strength in the Economy

May 2, 2014

More evidence for the “snowdown” thesis is in. The unexpectedly strong April employment report, with a gain of 288,000 jobs, surprised pretty much everyone, and shows that hiring has come back in a big way after the weak first quarter. Even more encouraging are the upward revisions to first-quarter job growth, with 36,000 more jobs created than were initially reported.

Continue reading → Leave a comment

5/1/14 – Gratitudes for the Day

May 1, 2014

Thinking about my recent post on how normal everything has become, I realize that I should be more grateful for just that. Sitting here on my balcony in Kauai at the Commonwealth President’s Club conference, I certainly have other things to be grateful for as well.

Continue reading → Leave a comment

4/30/14 – Weak First Quarter: A Surprise, But Not to Worry

April 30, 2014

Economic growth came in well below expectations this morning, at 0.1 percent instead of the 1.2 percent generally expected. Ouch. Is this something we should be worrying about?

Continue reading → Leave a comment

4/29/14 – Off to Hawaii

April 29, 2014

I’m at the airport on my way to the Commonwealth President’s Club conference, so this will be a brief post. As I’ve written many times before, I love these conferences for a bunch of reasons—the venues, the events, and, most of all, the people.

Continue reading → Leave a comment

4/28/14 – Which Economic Statistics Are Worth Looking At?

April 28, 2014

You can spend all day, every day, looking at and analyzing the plethora of economic and market data. I know, because that’s pretty much what I do. What you find after a while, though, is that much of this information is either redundant or meaningless (or apt to be revised so much that it might as well be).

Continue reading → Leave a comment

4/25/14 – Confidence and Earnings

April 25, 2014

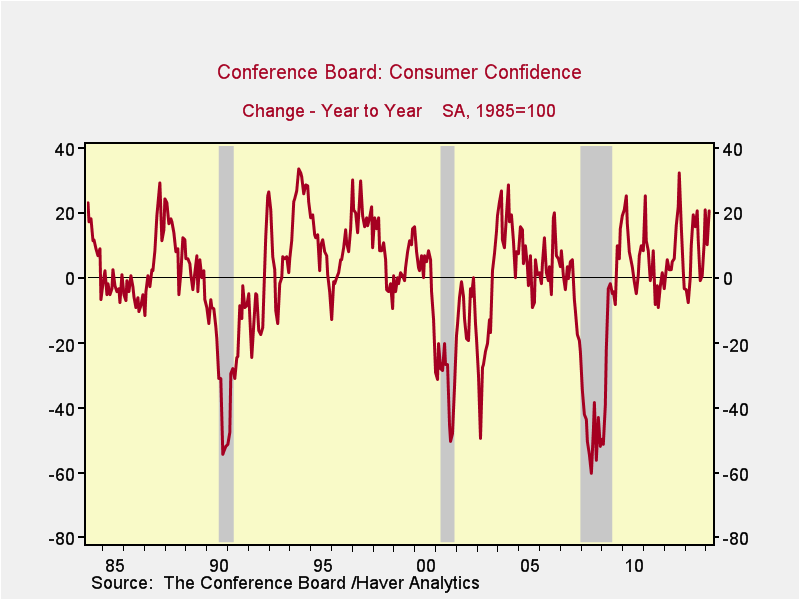
Consumer confidence will play an increasingly important role in supporting stock prices as earnings show signs of rolling over.

Continue reading → Leave a comment

4/24/14 – Six Views of the Initial Jobless Claims Data

April 24, 2014

Today’s post is inspired by Thirty-Six Views of Mount Fuji, a series of woodblock prints by the Japanese artist Hokusai that depicts the same scene from various perspectives, yielding very different images. Data can be viewed the same way, with various angles giving different impressions and potentially leading to very distinct conclusions.

Continue reading → Leave a comment

4/23/14 – Should We Worry About the Housing Slowdown?

April 23, 2014

The headline for this morning is that new home sales are down more than 14 percent on a month-to-month basis. This comes in tandem with drops in mortgage applications and a much smaller drop, of less than 1 percent, in existing home sales. With rates up, and demand potentially declining as institutional buyers pull back, is it time to worry that the housing recovery is over?

Continue reading → Leave a comment

4/17/14 – Why Financial Advisors Are the Good Guys

April 17, 2014

My son, Jackson, is almost six, and we are starting to have conversations about what Daddy does for work. Since he is also at the age where we spend an inordinate amount of time talking about good guys versus bad guys—particularly in the context of Star Wars—this also tends to bleed over into other areas. So, of course, it got me thinking about where we, as an industry, stand.

Continue reading → Leave a comment

4/16/14 – What Happens When Interest Rates Rise? Part 3: The Effects on Investments

April 16, 2014

This is the last installment in our series on rising interest rates. Here, we’ll cover what everyone really wants to know: What do rising rates mean for our investments?

Continue reading → Leave a comment

Subscribe via Email

AI_Community_Podcast_Thumb - 1


Episode 16
February 11, 2026

Episode 15
January 15, 2026

Episode 14
December 17, 2025

Episode 13
November 19, 2025

Episode 12
October 14, 2025

More


Hot Topics


New Call-to-action

Archives

see all

Subscribe


Disclosure

The information on this website is intended for informational/educational purposes only and should not be construed as investment advice, a solicitation, or a recommendation to buy or sell any security or investment product. Please contact your financial professional for more information specific to your situation.

Certain sections of this commentary contain forward-looking statements that are based on our reasonable expectations, estimates, projections, and assumptions. Forward-looking statements are not guarantees of future performance and involve certain risks and uncertainties, which are difficult to predict. Past performance is not indicative of future results. Diversification does not assure a profit or protect against loss in declining markets.

The S&P 500 Index is a broad-based measurement of changes in stock market conditions based on the average performance of 500 widely held common stocks. All indices are unmanaged and investors cannot invest directly in an index.

The MSCI EAFE (Europe, Australia, Far East) Index is a free float‐adjusted market capitalization index that is designed to measure the equity market performance of developed markets, excluding the U.S. and Canada. The MSCI EAFE Index consists of 21 developed market country indices.

The Dow Jones Industrial Average is computed by summing the prices of the stocks of 30 large companies and then dividing that total by an adjusted value, one which has been adjusted over the years to account for the effects of stock splits on the prices of the 30 companies. Dividends are reinvested to reflect the actual performance of the underlying securities.

The Russell 2000 is a market-capitalization weighted index, with dividends reinvested, that consists of the 2,000 smallest companies within the Russell 3000 Index. It is often used to track the performance of U.S. small market capitalization stocks.

One basis point (bp) is equal to 1/100th of 1 percent, or 0.01 percent.

The VIX (CBOE Volatility Index) measures the market’s expectation of 30-day volatility across a wide range of S&P 500 options.

The forward price-to-earnings (P/E) ratio divides the current share price of the index by its estimated future earnings.

Third-party links are provided to you as a courtesy. We make no representation as to the completeness or accuracy of information provided on these websites. Information on such sites, including third-party links contained within, should not be construed as an endorsement or adoption by Commonwealth of any kind. You should consult with a financial advisor regarding your specific situation.

Member FINRASIPC

Please review our Terms of Use

Commonwealth Financial Network®