Check out Brad’s May 20 interview on CNBC’s Worldwide Exchange, where he offers his thoughts on recent U.S. equity market growth and Treasuries.
May 20, 2014
Check out Brad’s May 20 interview on CNBC’s Worldwide Exchange, where he offers his thoughts on recent U.S. equity market growth and Treasuries.
One of the major causes of stock market losses is unforeseen declines that make people sell out—often at the worst time. This is one of the reasons I’ve focused much of my recent research on using drawdown (instead of return variance) as a measure of risk. In my opinion, it provides a better metric for real-world investment performance.
The first question you might have, upon seeing that headline, is what’s the difference? Data is simply facts, without meaning or context. Information can be used as a basis to make decisions; it can be acted on.
If you ever want to be amused, get a cat to watch an ink-jet printer while it’s at work. I now have a laser printer at home, which still seems to fascinate the cat, but there’s no comparison to the ink-jet. Something about the print head scurrying back and forth under the cover must remind them of a mouse . . .
May 14, 2014
There are no blockbuster news stories today, but several items play into the theme of how “old normal” things have become.
May 12, 2014
As I write this Monday morning, stocks are up quite a bit on the day, with the S&P 500 pushing even closer to a new all-time high. The headline on Google Finance reads “U.S. Stocks Advance Amid Deals on Optimism Over Economy,” and all seems right with the world.
The markets seem to be rallying as the Russians dial down the Ukraine confrontation. After a couple of dips, it looks like we’re edging back into a risk-on mode, with Putin apparently deciding that he has what he needs and it’s time to back off.
May 5, 2014
This will be a short post, as I arrived home at 7:30 this morning after flying and laying over for the past 18 hours or so, so I am a little tired. That said, it was all worthwhile when Jackson came running out of the house to hug me as I pulled up in a cab, then tried to drag my bag—which weighed more than he does—into the house. We did it together—teamwork!
More evidence for the “snowdown” thesis is in. The unexpectedly strong April employment report, with a gain of 288,000 jobs, surprised pretty much everyone, and shows that hiring has come back in a big way after the weak first quarter. Even more encouraging are the upward revisions to first-quarter job growth, with 36,000 more jobs created than were initially reported.
Episode 11
September 10, 2025
Episode 10
August 13, 2025
Episode 9
July 23, 2025
Episode 8
June 18, 2025
Episode 7
May 14, 2025
The information on this website is intended for informational/educational purposes only and should not be construed as investment advice, a solicitation, or a recommendation to buy or sell any security or investment product. Please contact your financial professional for more information specific to your situation.
Certain sections of this commentary contain forward-looking statements that are based on our reasonable expectations, estimates, projections, and assumptions. Forward-looking statements are not guarantees of future performance and involve certain risks and uncertainties, which are difficult to predict. Past performance is not indicative of future results. Diversification does not assure a profit or protect against loss in declining markets.
The S&P 500 Index is a broad-based measurement of changes in stock market conditions based on the average performance of 500 widely held common stocks. All indices are unmanaged and investors cannot invest directly in an index.
The MSCI EAFE (Europe, Australia, Far East) Index is a free float‐adjusted market capitalization index that is designed to measure the equity market performance of developed markets, excluding the U.S. and Canada. The MSCI EAFE Index consists of 21 developed market country indices.
One basis point (bp) is equal to 1/100th of 1 percent, or 0.01 percent.
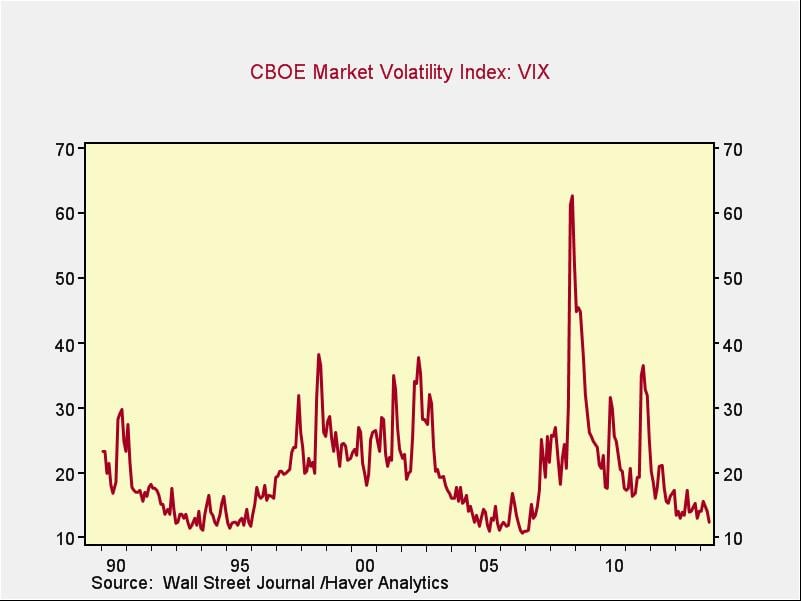
The VIX (CBOE Volatility Index) measures the market’s expectation of 30-day volatility across a wide range of S&P 500 options.
The forward price-to-earnings (P/E) ratio divides the current share price of the index by its estimated future earnings.
Third-party links are provided to you as a courtesy. We make no representation as to the completeness or accuracy of information provided on these websites. Information on such sites, including third-party links contained within, should not be construed as an endorsement or adoption by Commonwealth of any kind. You should consult with a financial advisor regarding your specific situation.
Member FINRA, SIPC
Please review our Terms of Use.
Commonwealth Financial Network®