 This will be a short post, as I’m at the Commonwealth Leaders Conference in Hawaii this week. (Tough job, I know, but someone has to do it.) Every time I go on one of these trips, I am amazed and humbled by the caliber of people I get to work with—and very grateful for the chance to do so.
It’s shaping up to be a busy day, so here are some quick thoughts on wage growth.
In nominal terms, wage growth not so hot
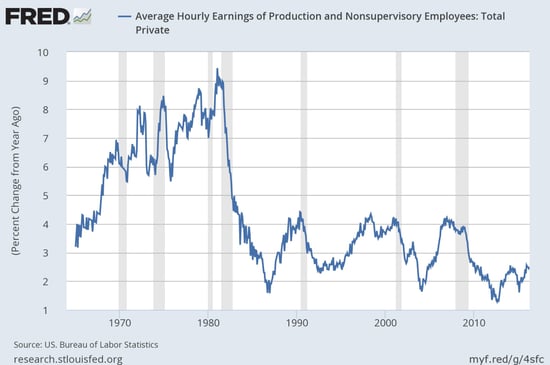
There's been a great deal of discussion about the subpar economic recovery, but is that really the case? With the most recent jobs report showing that wage growth has continued to accelerate, it’s worthwhile to take a look at wage growth over time.
On the face of it, it seems irrefutable that wage growth is nowhere near levels of the past. On a nominal basis, including inflation effects, that is certainly true, as you can see in the chart below.

We have to remember, though, that the much higher growth rates of the 1970s and early 1980s also included much higher levels of inflation. Even the 1990s and 2000s had inflation levels higher than we do now.
In real terms, we’re doing pretty well
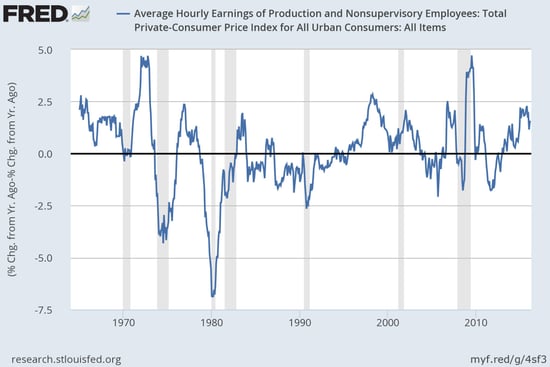
What happens when we subtract the changes in the price level (i.e., inflation) from those wage growth rates? This is a much better indicator of actual purchasing power.

All of a sudden, the current recovery doesn’t look nearly as bad.
Current wage growth levels, on a purchasing power basis, have been quite competitive with past recoveries, including the mid-2000s and the early to mid-1990s, and are better than the 1980s. In fact, real wage growth in this recovery exceeds every period except the boom years of the late 1990s and the period just before the last financial crisis.
You can argue with my methodology here—it’s a quick and dirty calculation, simply subtracting inflation from wage growth—but it provides a reasonable basis for believing that things are much better than they seem, when you adjust for inflation.
Think of it this way: If you got a 10-percent raise, but the price of everything also went up by 10 percent, would you really be any better off? No. On the other hand, if you got a 2-percent raise, but prices remained constant, you would be able to buy more and would therefore end up ahead. This is what the chart above adjusts for.
Money illusion—the idea that more money is better even if it can’t actually buy any more—is a surprisingly common tendency. With the unemployment rate declining to very low levels, job openings at all-time highs, and companies reporting difficulty finding qualified workers, it would be very strange if wage growth were actually as weak as it appears. The good news is, it isn’t.


 Print
Print


