

 Print
Print Economic questions come in cycles. Recently, with the relatively hawkish tone of the Fed and the turmoil in Washington, DC, economic worries have spiked again, and the velocity of money has become a hot topic.
Several people have asked me whether low money velocity presages a crash, a recession, or something equally bad. It’s a fair question. We’ve been down this road before, though—most recently last year. A low money velocity did not spell problems then, and it shouldn't mean problems now.
Let’s start with some definitions
Money stock: Money stock is conceptually simple, meaning the total amount of money in a country’s economy at a given time. From here, however, it gets complicated. What is included in money? It should certainly include cash that people hold, but how about cash in banks? How about traveler's checks? Bank accounts? Does it make a difference if the bank accounts are checking, which is available on demand, or savings, which may not be? How about money market accounts?
You get the idea. Nothing in economics is simple, but for our purposes, we can look at two of the most commonly used measures of money, known in the U.S. as M1 and M2:
- M1 includes cash in circulation, traveler's checks, and checking accounts.
- M2 adds savings accounts, individual money market accounts, and CDs of less than $100,000.
These are reasonable reflections of the actual cash in circulation, what the average person has available.
The big thing missing here is the banks. A separate money classification, MB (or the monetary base), includes cash in circulation, cash at banks, and Federal Reserve bank credit that banks have access to but do not have in their physical control. In other words, MB is the amount of money that banks have to create actual consumer money, which is shown as M1 or M2.
MB is the most liquid measure of money, but largely in its potential. The economy depends on the banks to translate this money into money that is working in the economy. The key point here is that reserves are not actually part of the economy until the banks lend them out; therefore, they don't show up in the usable money stock (M1 or M2), and as such, do not typically factor into money velocity calculations.
Velocity of money: This is defined as the price level times the number of transactions, divided by the money stock. More simply, this is the economy as a whole (the gross domestic product) divided by the money stock.
Changes in money velocity, then, are a function of two things: how fast the economy is growing, and how fast the money supply is growing. You have to consider both.
Should we be worried?
The reason to worry over a declining money velocity is if it reflects a shrinking economy. If, on the other hand, the declining velocity is due to the money supply growing faster than a growing economy, this should indicate a growth problem. It might lead to other problems such as inflation, of course, but that is not the current worry.
You can see from the chart below that, over the past 10 years, money supply growth and GDP growth have actually gone in opposite directions. When GDP growth was weak, the money supply grew faster, and when economic growth accelerated, the money supply grew more slowly.
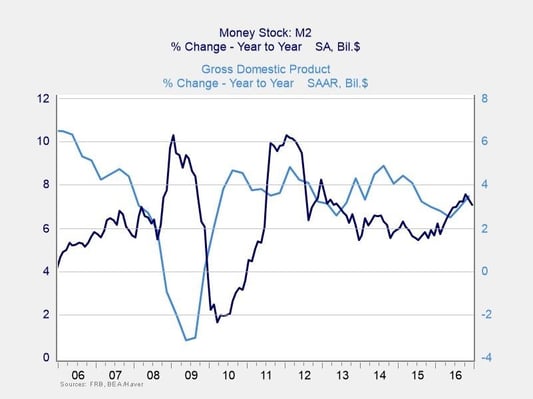
There is no mystery to this. Collapses in economic growth led to stimulus measures, which were then dialed back when things got better. Growth in the stock of money has spiked twice in the past 10 years, after the crisis in 2008 and the European crisis in 2011, but even beyond that, it has outpaced growth in the economy as a whole as monetary stimulus continued. (I have used M2 as the more inclusive monetary number here.)
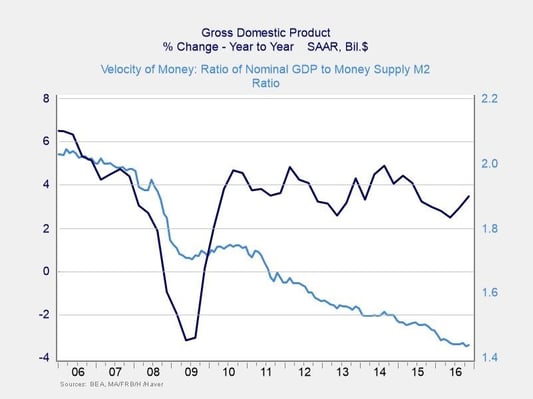
What should this mean? If the money velocity equation is GDP/M2, and M2 is growing faster than GDP (which it is, for the reasons we discussed above), you would expect money velocity to be declining. And that is just what we do see over the past 10 years in the chart below. Note the substantial drops in 2008–9 and 2011, just when the money stock spiked. Note also that the velocity of money has continued to decline since the crisis, even through the recovery in growth after the crisis and over the past four years, as GDP growth stabilized.
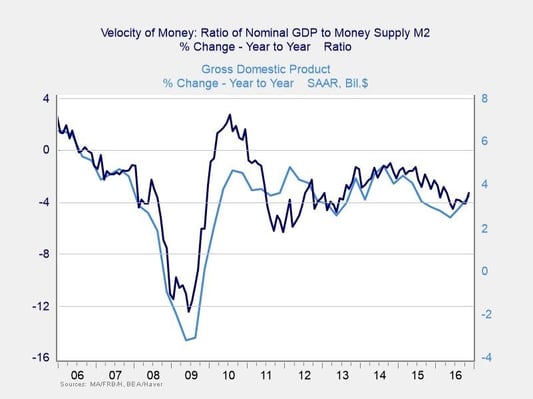
None of this is to say that the velocity of money is not useful information, just that the changes being talked about are simply a result of the math associated with post-crisis policies, rather than something deeper. That said, though, one way to deconstruct the policy changes and the economy is to look at the changes in money velocity as compared to economic growth.
Per the chart below, we do see a direct correlation, and one that makes causal sense. A faster-growing economy means a higher money velocity, even when stimulus is applied, so velocity is a symptom and not a cause. This chart also shows that both growth and velocity are improving in recent quarters, which again is what you would expect if velocity followed growth rather than caused it.
Basically, the decline in the velocity of money is due to math rather than economic dysfunction, and it's not necessarily a signal of economic trouble. Indeed, if we consider a decline in the velocity of money as a problem, the most recent data show the problem has started to improve.
That improvement is likely to continue, both with faster economic growth and also the slow removal of monetary stimulus. Though we have many things to worry about, this does not appear to be one of them. Remain calm and carry on.


