 Brad here. Back in August, Peter Essele, a lead portfolio manager at Commonwealth, wrote a very timely piece on the risks involved with low-volatility strategies. When we were talking the other day, he suggested writing a follow-up on that—and given what has happened since his original post, I agreed it was a great idea.
Here, you’ll get another glimpse into how a professional (and very good) investment manager thinks. I find this kind of review very helpful to my own thinking. Over to Pete. Enjoy!
Is low volatility the new high volatility? It certainly appears that way.
In my previous post on low-volatility strategies, I talked about how popular these strategies had become, and I cautioned investors about the overvaluation of low-volatility products with relatively large exposures to traditional safe-haven sectors, such as utilities, telecom, and consumer staples. At the time, the S&P 500 Low Volatility Index was trading at a price-to-book ratio of roughly 3.3 while the S&P 500 Index, which many perceived to be overvalued, was trading at only 2.8. In addition, utilities, an over-weighted sector across most low-volatility strategies, was trading close to its highest price-to-earnings ratio in 30 years!
Now, just three months later, we are witnessing a period where low volatility is becoming high volatility, as those overvalued safe-haven sectors begin to decline and investors question the investment thesis behind so-called low-volatility products.
Like any investment, however, investors should not only question the investment case behind a purchase, but also the price at which they are buying. In the case of low-volatility options during late 2015 and early 2016, the purchase price relative to perceived value was well above anything we had seen in years.
Why are low-volatility areas selling off?
The answer is twofold. First, as mentioned above, valuations started to become wildly out of control this year following the massive inflows into low-volatility strategies and dividend-paying securities. What we’ve witnessed over the last few months appears to be a bit of mean reversion to more normalized levels, although things are still looking rich compared with historical norms.
Second, the downturn has been exacerbated by the recent acknowledgment from markets that a changing of the guard in Washington will coincide with increased fiscal spending and lower taxes, policies that can be inflationary and raise the national debt burden. Obviously, this doesn’t bode well for holders of Treasury securities in the long run, nor is it good news for bond-proxy areas within equities, such as utilities and telecom.
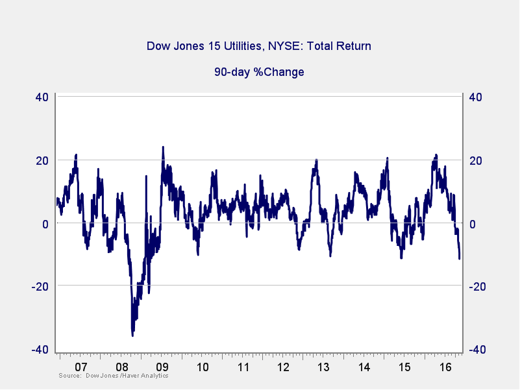
Since the election, the 10-year Treasury bond yield has moved higher by roughly 40 basis points (0.40 percent)—a significant move in just over a week. The utilities sector, as evidenced by the Dow Jones 15 Utilities Index, has fallen 6.37 percent over the same time period, while its 90-day change is –11.64 percent, the largest three-month decline since 2009.

What can we learn from this?
As I mentioned in the August post, I and my colleagues on the Investment Management team are strong believers in contrarian, fundamental investing, a strategy that is often at odds with herd behavior. Although it’s not a bulletproof approach to asset allocation, it can help shed some light on the perceived risk within certain areas and help you avoid over-concentrations in sectors or asset classes that are trading well above long-term averages.
Brad again. All too often, it is easy to move on without looking back. Pete made some excellent points in August, and the risks he pointed out are now happening. This is a key part of what we, as investors, should be doing with every position. Where are the risks? Why might they happen? How exposed am I? As he concludes, being a contrarian—or at least thinking like one—is a great way to address just those questions.
*The Dow Jones 15 Utilities Index is a price-weighted average of 15 utility companies that are listed on the New York Stock Exchange and are involved in the production of electrical energy.
Asset allocation programs do not assure a profit or protect against loss in declining markets. No program can guarantee that any objective or goal will be achieved.


 Print
Print


