

 Print
Print Today’s post is by guest contributor Peter Essele, a portfolio manager on Commonwealth’s Preferred Portfolio Services® Select platform.
"Does the high level of fund flows into the most popular indices make them perform better simply due to supply/demand 101?"
That question was recently posed by one of Commonwealth’s astute advisors, who had become concerned about the demand for so-called low-volatility options that overweight areas such as utilities and telecom—traditional safe-haven sectors that are trading well above long-term averages.
Put another way: “Does an accelerated flow of assets into a constrained basket of underlying securities have any impact on price?”
The answer, we believe, is yes.
Influx of assets impacts valuations
Apart from the Kardashian/Swift feud, 2016 will probably be remembered as the year of low-volatility strategies that promised investors equity-like returns with less turbulence than traditional market-weighted options. Demand for these types of products has been significant over the last 12 months, which is starting to make some investors worry about valuations and forward returns.
Commonwealth’s Research team has studied the relationship between asset flows and value many times over the years. Can fund flows into a particular asset class tell us anything about future returns? Historical trends across most asset classes show that an inverse relationship between the two certainly exists. In many cases, we have found that the larger an asset class’s growth over the prior 12 months relative to historical trends, the lower the forward 3-year returns.
Could this time be different? As of early this month, utilities was one of the most expensive sectors in the S&P 500, at a price-to-earnings ratio of 19.1 after returning 19 percent year-to-date.
Price-to-Earnings Ratio, S&P 500 Utilities Sector
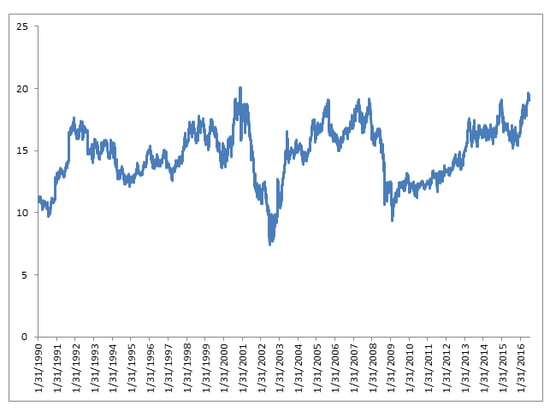
Two other traditional safe-haven sectors, telecom and consumer staples, have also exhibited strong performance in 2016, with the latter returning almost 20 percent year-to-date.
Historically, during market rallies, investors have paid a premium for areas that exhibit above-average earnings growth. Now, during one of the strongest bull markets in the last 50 years, three safe-haven sectors that generally outperform during flight-to-quality periods are leading the rally, and it’s starting to show up in valuations.
Investors should be wary
One explanation for the historically high valuations is the exceptionally strong demand for “low minimum” and “low volatility” investments that overweight these areas compared with traditional market-weighted options. For instance, one particular low-volatility product has a weighting to utilities that is 2.5x the S&P 500 utilities sector weight. Considering the popularity of low-volatility options and the small size of the utilities sector, it’s not too surprising that valuations are at 30-year highs.
These types of products have been a windfall for asset managers in 2016, as market participants are always looking for the holy grail of attractive returns with less risk. But every dollar that moves in is becoming more and more exposed to overweighted securities that are trading well above long-term averages.
As believers in contrarian, fundamental investing, we find it difficult to imagine that this style of investing will play out well for investors in the long run.


