 One of the assumptions I’ve made in my recent analyses of the markets is that we are not in—or close to—a recession. Although I stand by this view, it’s common sense that, at some point, the U.S. will see another recession. When that happens, stocks are very likely to pull back, and we might enter the bear market everyone fears.
In order to get ahead of that fear, let’s take an in-depth look at four key indicators that could signal a recession. This analysis is largely based on the statistics I use in my monthly economic update, and I hope it will shed more light on why these metrics are an important weather vane for the economy.
1. Employment
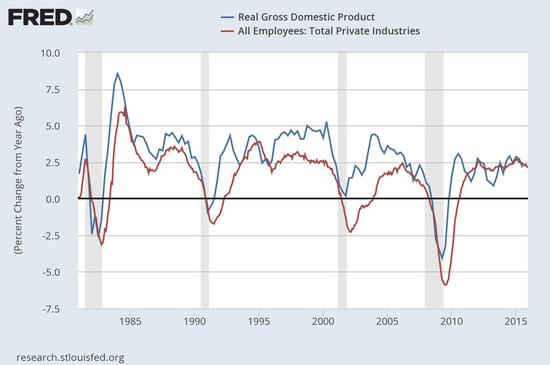
The chart below looks at year-on-year changes in employment. You can see that economic growth and employment growth are consistently highly correlated, which makes sense. Since 1980, drops in employment have preceded a recession, with the warning sign somewhere around a 1-percent threshold.

Certainly, job growth has slowed, but it remains around the high level of the mid-2000s and consistent with that of the late 1990s. This may indicate trouble to come in the next couple of years. But barring a steep drop-off—which the very strong December job creation number suggests is unlikely in the short term—the most critical element of economic growth remains at a healthy level.
2. Consumer confidence
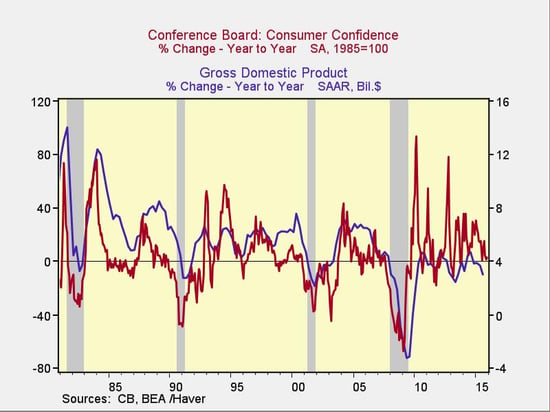
People buying things drives two-thirds of the U.S. economy. If consumers aren’t confident, we get into trouble. Consequently, we can track changes in consumer confidence as a signal of how the economy is doing. As you can see, a drop in consumer confidence by about 20 percent over the prior year has signaled all of the recessions since 1980.

Once again, this indicator shows slowing growth. This is reasonable for this stage of the cycle, as confidence has largely recovered to healthy levels, and we can’t expect to see much more actual improvement. What we don’t see is a decline. Typically, it takes at least a couple of quarters to see a downturn of 20 percent. So, between that delay and the usual lag, this metric suggests we’re at least four quarters from a possible recession.
3. Service sector
Workers and consumers are the most important pieces of the economy, but they’re not the only ones. The service sector is important for several reasons, the biggest of which is that it accounts for about seven-eighths of the economy (i.e., all of the pizza except one slice). Reported statistics are heavily slanted toward manufacturing, which is easy to measure—you simply count widgets. But the service sector is what matters most, although we see fewer statistics on it.

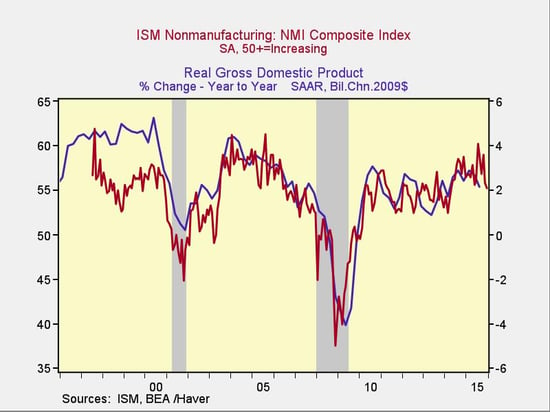
The most important indicator is the Institute for Supply Management’s survey of service businesses, known—in a nod to the dominance of manufacturing and industrial statistics—as the nonmanufacturing index. This data series is shorter than the others we use but shows the same effect: when the service sector declines year-on-year, we have a recession 6 to 18 months later. The worry point is around 52.
Despite a short-term pullback from close to a record high, we remain in healthy territory, consistent with the 1990s and 2000s. It would take a significant pullback to land us in the trouble area. Although this could happen quickly, past results have been slower. Coupled with the delay before a recession actually starts, this means we’re likely looking at 12 months or so, at the soonest, and probably longer before an actual recession.
4. Yield curve
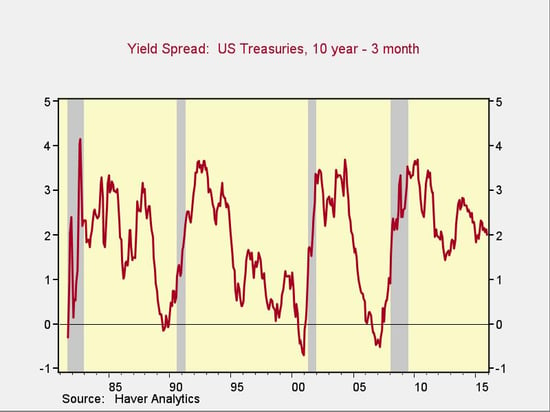
The last piece of the puzzle is what’s known as the yield curve, which measures the difference between longer-term interest rates and shorter-term ones. If longer rates are lower than shorter rates, this “inverts” the yield curve—a bad sign. Here’s an easier way to look at it: simply subtract the shorter rates (in this case, the 3-month Treasury rate) from the longer-term rates (in this case, the 10-year Treasury rate), as in the following chart:

You can see that when the spread between long- and short-term rates drops to zero or below, a recession follows in a couple of quarters. Once again, though, this indicator remains at healthy levels. Even with the recent Fed rate increases, the spread is nowhere close to the worry zone.
A recession is coming—one of these days
Any one of these indicators could be wrong, of course, and the fundamentals behind any of them can be argued. Perhaps employment is worse than it seems, or perhaps the Fed’s policy makes the yield spread misleading. In aggregate, however, they represent a broad spectrum of the economy and the drivers of growth. When all of the indicators are positive, as they are now, it suggests that the economy is fundamentally healthy—and any recession is some time away.
You might also note that these metrics cover a number of economic cycles, with different economic fundamentals and shocks in each. Again, you could argue with the indicators for any particular cycle. But, overall, the results are consistent.
There is certainly a recession coming someday, but I don’t think it will be soon. And when one does get close, I suspect decay in these key indicators will provide ample warning.


 Print
Print


