

 Print
Print In yesterday’s post, we concluded that interest rates were influenced—but not set—by the Fed. We also observed that rates were influenced—but not set—by the supply and demand of capital. We noted in both cases, however, that there was considerable variance over what those two models indicated, which suggests there is something else going on.
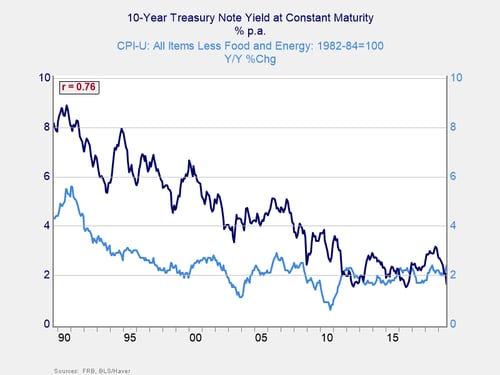
To figure out what that “something else” is, I want to dig a bit deeper into the rates themselves. In theory, rates consist of three parts: a foundational risk-free rate, which is what investors need to put off current consumption; plus compensation for credit risk; plus compensation for inflation risk. If we use U.S. Treasury rates as the basis for our analysis, we can exclude credit risk (yes, I know, but work with me here) and are left with the risk-free rate plus inflation.
U.S. Treasury rate
The chart below shows that relationship, with rates highly correlated with inflation. But it also shows something different: beyond the drop in inflation, there was something else happening to bring interest rates as low as they are. The risk-free rate, which is the gap between the 10-year Treasury rate and the inflation rate, has declined as well.
Risk-free rate
We can see that decline clearly in the chart below, which shows the risk-free rate, calculated as the 10-year Treasury rate less core inflation. From the early 1980s to the early 2010s, that rate declined steadily. While inflation went up and down and geopolitical events came and went, there was a steady decrease in what investors considered to be a base level of return. In recent years, that risk-free rate has held fairly steady at around zero.
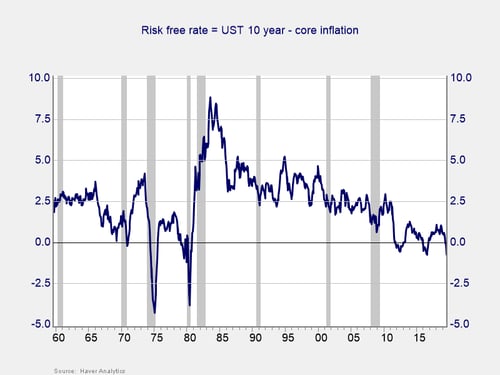
Any explanation for this behavior has to account for both the multidecade decline and the recent stabilization around zero. It also has to account for the fact that we have been here before. By analyzing rates in this way, we can see that current conditions are not unique. We saw something similar in the late 1960s through 1970s.
Population growth
There are not too many factors that have a consistent trend over decades, which is what is needed to explain this kind of behavior. There are also few factors that operate at a base level to affect the economy. The only one that fits the bill, in fact, is population growth. So, let’s see how that works as an explanation.
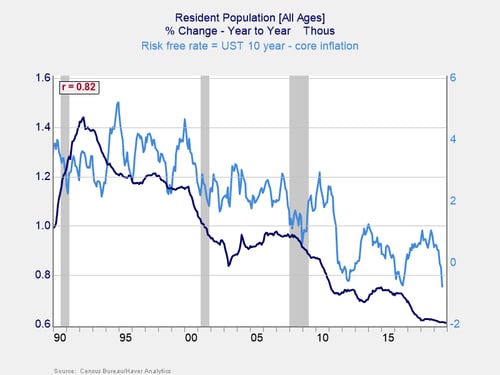
As the chart shows, population (specifically, growth in population) works very well. From 1990 to the present, slowing population growth has gone hand in hand with lower risk-free rates. Empirically, the data is solid, but it also makes theoretical sense. Younger populations tend to grow more quickly, while older ones grow more slowly. A growing population needs more capital, to build homes, businesses, and so forth. But slower growth depresses the demand for capital.
This model incorporates both the Fed and market models, but it gives them a more solid foundation. It also explains why rates have remained low recently, despite both the Fed and market models signaling they should rise. With population growth low and likely to stay that way, there will continue to be an anchor on rates going forward.
This model also provides an answer to one of our earlier questions, as to why rates in the U.S. are higher than in Europe and why European rates are higher than in Japan. Looking at relative population growth, this scenario is exactly what we should see—and we do. If we consider when rates started trending down in Europe and Japan, we also see that the timelines coincide with slowdowns in population growth. Few things are ever proven in economics, but the circumstantial evidence, over decades and around the globe, is compelling. Low population growth leads to low risk-free interest rates.
The answer to our question
Rates are low because population growth is low. Rates are lower elsewhere because population growth is even lower. This situation is not going to change over the foreseeable future, so we can expect lower rates to persist as well. This answer still leaves the question of inflation open, of course, but that is something we can watch for separately. The underlying trend will remain of low rates. And that really is different—if not from history, as we saw above, at least from most expectations.
As you might expect, this explanation has interesting implications for both economic policy and our investments. We will finish up next week by looking at those topics.


