

 Print
Print Recently, there have been a number of headlines declaring that the national debt has moved above $22 trillion, with an emphasis on how much it has gone up in recent decades.
Well, the headlines are true, as you can see in the chart below. In fact, we have added about $16 trillion since 2000, or about $900 million per year; $11 trillion since 2008, or about $1.1 trillion per year; and $2 trillion since the end of 2016.
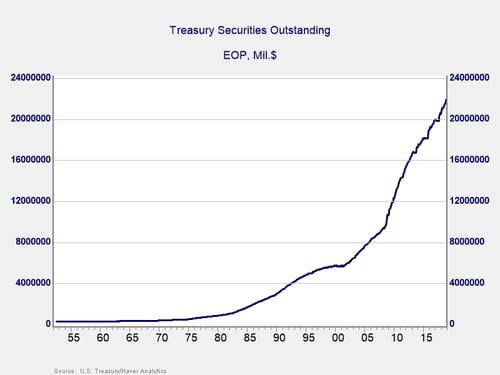
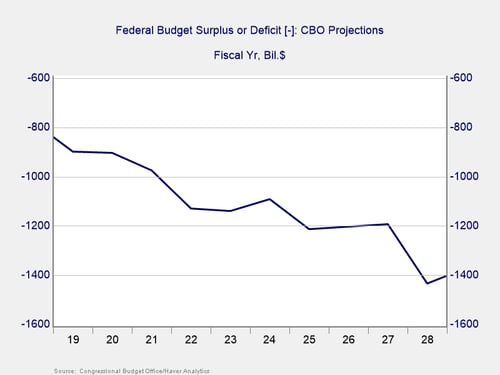
Looking forward, the nonpartisan Congressional Budget Office expects the deficit to get even worse. With about $1 trillion or more per year added to the debt over the next decade, the debt could be more than $30 trillion by 2030.
A different way to look at the numbers
These horrifying numbers are driving those headlines. But there is a more accurate—and somewhat less scary—way to look at the national debt: as a proportion of the economy. After all, it isn’t the amount of debt that matters; it is the ability to pay. For example, a $100,000 mortgage can be either a crushing burden or no big deal, depending on both your income and the interest rate. The same is true for the national debt.
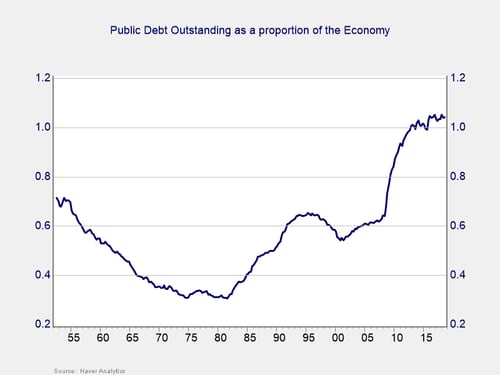
Proportion of the economy. As the economy grows, so does the country’s ability to support a higher debt load. So, a good way to analyze the debt is as a proportion of the economy as a whole. Here again, we see a significant rise in recent decades, with the largest increase coming in the aftermath of the financial crisis and the great recession. Note, however, that even as the debt rose in the 1990s and 2000s, the debt-to-economy ratio did not. Why? Economic growth—as the economy grew, often faster than the debt, the ability to pay actually stabilized or improved. We could borrow as much as we wanted as long as the economy grew faster than the debt. The economy certainly did not grow faster than debt during the crisis. But in recent years, as growth improved, we saw the debt-to-economy ratio stabilizing at around 1.1. This is still well above the levels of the 1990s and 2000s, but at least it hasn’t gotten much worse. If the economy continues to grow at a higher rate than the deficit, we can run the projected deficits indefinitely.
Interest rates. Another way to look at the situation is to consider interest rates. Again, if rates are low, you can afford a bigger mortgage, as the payment will be lower. The same rationale applies to government debt. As the chart below shows, rates have been declining since the early 1980s. Even as the debt has risen, it has become more affordable. Note, however, the recent rise in rates, which suggests that trend may be played out.
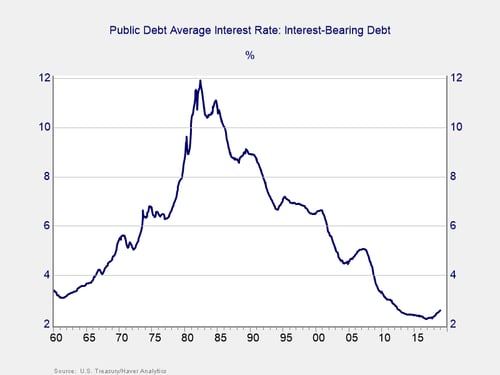
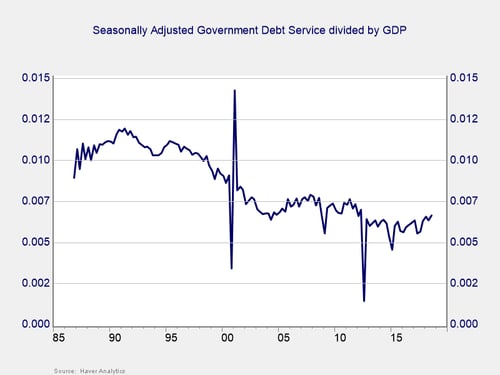
In other words, even as the total debt level has risen dramatically, the actual payments have been declining as a percentage of the economy, due to a perfect mix of lower interest rates and economic growth over the past couple of decades. Even as we borrowed more, it actually became more affordable, as you can see in the chart below. Again, note the recent uptick.
This scenario is at the core of the laissez-faire attitude toward the deficit and the debt in recent years by much of the investment and economics community. Although debt was high, it had stabilized as a percentage of the economy and, in any case, was relatively affordable. This supports the argument that there is no problem.
Here’s the real problem
The real problem is that the “no problem” conclusion relies on a continuation of two things: economic growth and low interest rates. As we can see in the charts above, rates have recently ticked up. Even if they don’t move up much more, there simply is not much room for a further decline. This tailwind has likely faded and may well turn into a headwind, as we saw in the interest rates chart.
The other assumption, of continued economic growth, is also likely to fail at some point. A recession is not likely this year but is certainly possible. If not this year, though, we will almost certainly see one in the next couple of years. At that point, with interest rates stabilizing or even higher and the economy not growing, we may well see another spike in the debt-to-economy ratio, as well as a meaningful increase in the debt service expense. Then, the economic risks will start to rise materially.
Moving in the wrong direction
We are not at that danger point yet, but the trend is in the wrong direction. The larger the deficit and the higher the accrued debt, the greater the chance of an economic accident. This is a big problem, but not an immediate one.
Tomorrow, we will tackle the next important question: is this a solvable problem? Spoiler alert—it is! But the solution will be painful.


