 After the decline at the end of the day yesterday, I’m getting more concerned about the next couple of weeks in U.S. markets. Although fundamentals remain strong, there appears to be a bigger break in confidence that could well lead to further downward movements.
Let’s take a look at where the market might be headed.
Potential declines by the numbers
To help frame our discussion, these numbers show what market declines of different magnitudes would look like for the S&P 500 Index. (All figures are rounded.)
- Market top – 2,135
- 10-percent correction – 1,921
- 15-percent correction – 1,815
- 20-percent bear market – 1,708
As I write this, the S&P 500 is around 1,900, down about 11 percent. A drop to a 15-percent correction would mean losing another 85 points, while a move to a bear market would mean losing about 185 points, taking us down to around 1,700.
I’m not saying any of this will happen, but these would be the numbers if it did.
Valuations leave room for further decline
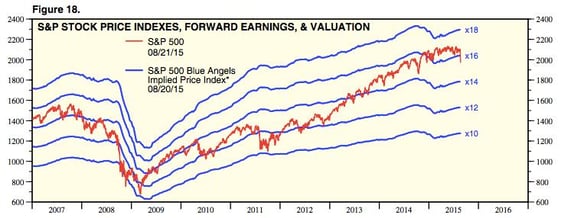
As I noted the other day, valuations have bounced around between 10x and 18x forward earnings since before the crisis, as shown in this chart from Yardeni Research.

With estimated forward earnings at $127.72, the valuation range above would result in the following values for the S&P 500, rounded to the nearest 10.
- 16x = 2,040
- 14x = 1,790
- 12x = 1,530
We’re now at 14.9x or so, near the 15x level that prevailed in 2007 but above the valuations since the end of 2013. In other words, we’re still above valuations that prevailed until pretty recently and at about the level of just before the crisis.
From a valuation perspective, then, there appears to be room for a further decline. The question is how far that could go.
What a 12x valuation would mean for U.S. markets
With the exception of crisis periods, such as 2008 and 2011, valuations tend to bottom out around 12x. Despite everything now happening, I do not believe we’re approaching a crisis period similar to either of those times. Given strong U.S. fundamentals, even if the rest of the world does get worse, we’re likely to ride out the turmoil much more easily than we have in the past.
A valuation of 12x would bring us to an S&P 500 of 1,530, rounded—a drop of about 28 percent from the peak and an additional decline of about 370 points from where we are now. (The decline so far is about 235 points.) In other words, the market may lose even more if we drop to noncrisis bottom valuation levels.
Before you panic, however, remember that this is a worst-case scenario, simply an illustration of how bad it might get. It certainly isn’t the most probable case.
Even if it were to occur, the chart above shows that declines to a level of 12x typically don’t last very long and are followed by fairly quick recoveries to higher valuations. With earnings increasing at the same time, stock prices that get hit the hardest often have a tendency to bounce back hard as well.
14x looks like a more reasonable downside valuation
It’s interesting to note that, in the aftermath of the crisis, valuations bounced back to 14x, which I think is a reasonable potential downside valuation for today. At 14x, the S&P 500 would be around 1,790, about 100 points below where it is right now—a 16-percent correction, right in line with historical results. This would represent a further decline, but a much more moderate one.
Markets may well be stabilizing. But even if they do, it’s important to understand the downside exposure, which will remain, despite any stabilization or recovery. Fundamentals are strong and should limit damage, but we shouldn’t be surprised by further volatility.


 Print
Print


