 Yesterday, we concluded that the recent decline in money velocity is due to the money supply increasing faster than economic growth, rather than a collapse in growth itself. So, at worst, slower money velocity is a symptom of potential trouble rather than a cause.
Today, let’s consider another side of the issue: is the fact that growth in the money supply exceeds that of the economy itself either a symptom or cause of future economic trouble?
Economic growth and the money supply: what's the relationship?
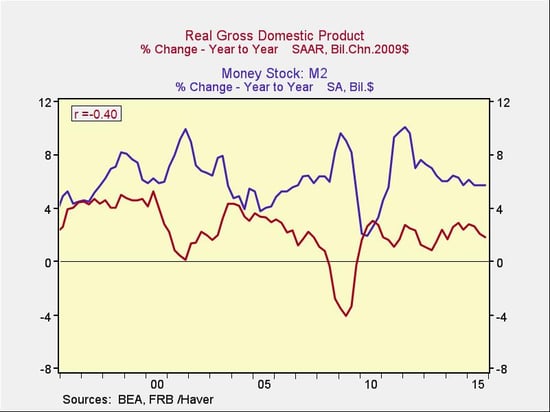
Looking back 20 years. The following chart shows the connection between growth and changes in M2 over the past 20 years.

As you can see, there has been a significant negative correlation between money supply growth and economic growth—that is, the faster the money supply grew, the worse the economy did, which is exactly the worry many have now. But before we conclude that fast money growth caused poor economic performance, we have to consider whether the bad economic performance caused the spike in money growth, rather than the other way around.
From a timing perspective, this looks quite plausible, as you can see above. From a policy perspective, with both the Greenspan and Bernanke Feds, it seems not only plausible but very likely. From an economic point of view, with two of the largest crises in history in the past 20 years giving rise to large monetary policy responses, it also seems likely. If so, the rise in money supply growth was not a cause of poor economic performance but a consequence.
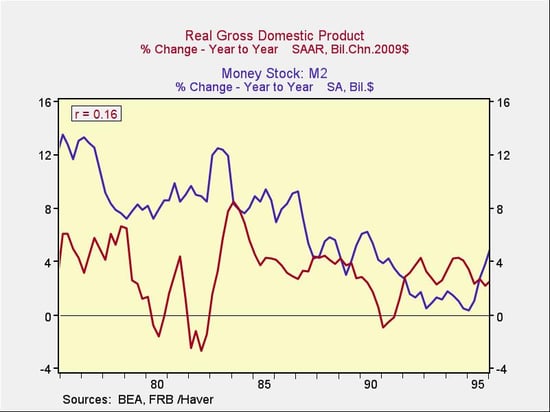
Looking back 40 years. If that’s the case, the normalizing growth rate is actually a positive sign for the future. In order to test this idea, let’s consider the relationship between money supply and growth in another time period—say, the previous 20 years, as shown in the following chart.

Here, you can see that the relationship between money supply growth and economic growth was positive, not negative, suggesting that the experience of recent years isn’t necessarily indicative of the future. The positive relationship was not large, of course, but this time period indicates that money supply growth hasn’t necessarily been bad for the economy.
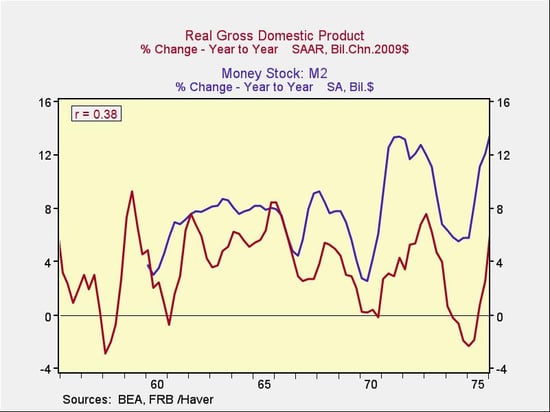
Looking back 60 years. On the other hand, the 40-year time period also has its issues—notably, the inflation in the late 1970s and the Volcker high-interest-rate regime in the 1980s. If we go back another 20 years, we see that the relationship between money growth and economic growth is almost exactly the opposite of the past 20 years, as shown in the following chart.

The change in the relationship between money supply growth and economic growth therefore seems reasonably related to monetary policy, which in turn depends to a large extent on economic events such as inflationary trends.
What happens when we compare money supply growth with consumer inflation trends? Once again, we see the same thing: a negative relationship, a positive relationship, and no relationship. With no consistency, there seems to be no direct causal link.
What does experience tell us?
Given the mixed historical data, let’s think things through from basics. From a fundamental perspective, we should see the money supply grow along with the economy, as a larger economy needs more money to function. Last century, this is largely what happened, as the positive correlations between money supply and the economy show.
The reversal of that relationship this century is clearly inconsistent with fundamental expectations, as well as the actual experience of times when monetary policy was less active. The current relationship is therefore an aberration, caused by unusual monetary policies, which in turn were caused by—and not the cause of—recent economic crises.
This is good news. Going forward, we can expect that, as monetary policy normalizes, we will probably return to that positive relationship, where a growing economy needs more money and drives expansion of the money supply—which is exactly what we are seeing. The news isn’t all good, though, as the current growth rate of the money supply is actually slower than that of previous periods—and may well augur slower growth rates. Again, this would be consistent with both expectations and actual experience.
Although slower growth is not the conclusion we might hope for, it’s certainly better than a looming crisis. Based on our analysis, there is no real evidence that the current growth in the money supply could lead to one. Given the alternatives, I'll take continued growth, slow though it may be.


 Print
Print


