 The political reaction to the tax reform bill that was recently passed has grown more favorable over time. Initially, people appeared skeptical. But now that lower withholding rates are actually showing up in paychecks, the sentiment is turning more positive. Economically, we are seeing the same thing. Consumer confidence is rising again, due at least in part to larger paychecks. That should also translate, over time, to faster growth as both people and businesses are increasingly willing and able to spend. The recent debt ceiling deal should also help economic growth, with hundreds of billions of dollars in additional spending. This kind of fiscal stimulus will certainly help growth accelerate this year.
This is wonderful news in the short term, as faster growth was one of the main objectives of the tax bill. Unfortunately, it also has an unintended consequence. That is, it takes an existing problem—the deficit and the debt—and makes it much worse, much faster. While this has been a rising concern for some time, it has not been an immediate problem for the past several years after the spending cuts imposed by the sequester. The recent tax bill and debt ceiling bill will take the concern and make it an immediate one, probably within the next year.
Let’s start with the deficit
The tax cuts and spending bill could take the deficit from $666 billion in 2017 to more than $1 trillion in 2019 (and quite possibly in 2018). This will certainly add to the debt (which we will get to in a minute), but the more immediate consequence is in the financial markets. The U.S. government will be borrowing—will have to borrow—hundreds of billions more than last year. That increase in demand, given a limited supply of capital, will almost certainly force rates higher. Interest rates are the price of money; by simple economics, increased demand means higher prices given constant supply. So, the larger deficit will drive rates higher.
U.S. government debt
It will also add to the debt. U.S. government debt is around $20.5 trillion, according to the U.S. Treasury. If we add $1 trillion per year—and it will be more than that—over the next 10 years, that goes to $30 trillion or more. The absolute debt level is not a concern if we can afford it, any more than a $1 million mortgage is a concern if you make enough. The problem is that while we can afford it now, it gets harder and harder when either the debt level rises or interest rates increase. When both happen at once? The problem becomes much more urgent.
Where are we right now?
In late 2017, the average maturity of U.S. Treasury securities was just under six years (68.81 months), and the average interest rate on federal debt was around 2.244 percent, according to the Treasury. Just to get some idea of what higher rates might mean, the interest rate on U.S. Treasury 5-year and 10-year bonds over the past year has risen by 57 basis points and 49 basis points, respectively. If we take an average of that and apply it to the average maturity, that means, over time, the debt service cost will increase by more than $100 billion if rates rise by that much again in 2018, which seems quite possible. That is on the existing debt alone.

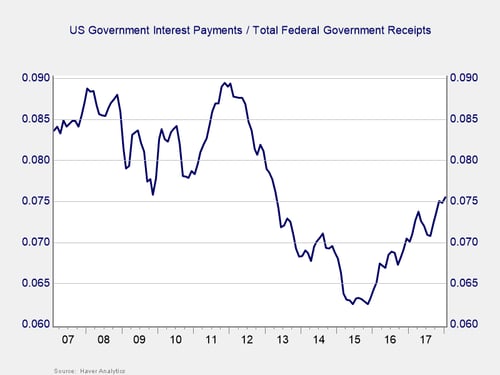
Worse, this is already happening, as you can see in the chart above. Even before the tax cuts and spending deal hit, we already saw interest rising as a percentage of total receipts, as both the debt increased and rates rose.
In fact, this is a primary cause of the rising deficit: we have to borrow to do everything we want—and borrow more to pay the interest on past borrowings.
Is this a solvable problem?
The real question here is not whether this is a problem. It is, and it is one that will become increasingly urgent. Instead, the real question is whether it is a solvable problem. Here, the answer is good. The problem is solvable, at least at this point, as we proved with the sequester spending cuts a couple of years ago. But the answer is not great, in that solving the problem will involve a great deal of pain.
As always with politics, change will not happen until the pain of the status quo is greater than that of change—again, as we saw with the fiscal cliff and the sequester. Expect to hear a lot more about this, and for the country to suffer again, before we actually do something about it.


 Print
Print

