 Yesterday was a wild ride. The market dropped steeply at the open, plunged even more at midday, and then came back strong, leaving us down just a little.
I was getting on a plane as it was dropping the most, and I have to admit it was an anxious flight. The market was the first thing I checked when we landed, and I was relieved to see the recovery.
What to make of the bumpy ride? In the short term, it looks like investors decided the market was a pretty good buy yesterday afternoon. Longer term, it’s hard to say. What we need is some context.
A look back to crises past
To provide some, I’ve been comparing the current situation with both 1998 and 2011.
- In 1998, if you remember, the Asian and emerging markets saw a currency and debt crisis that threatened to bring down the global financial system.
- In 2011, the eurozone was in turmoil about a Greek bankruptcy and the potential collapse of the European and worldwide banking systems.
- Today, we are facing debt and market crises in China and the emerging markets due to weak banking and financial systems, which threaten to bring down the world financial system.
Sound familiar? Given the many similarities between now and then, what can the 1998 and 2011 crises tell us about today?
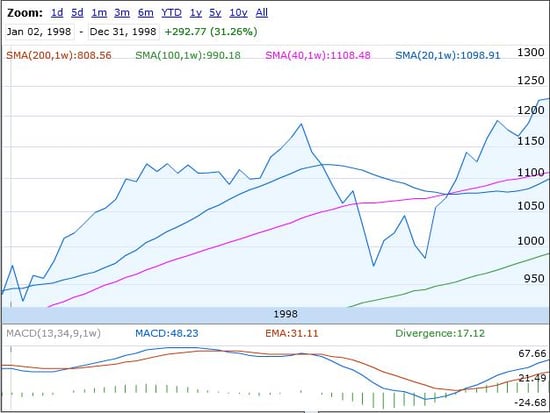
Let’s start by looking at the behavior of the S&P 500 in 1998.

Source: Google Finance
As the chart shows, we saw a decline, from peak to trough, of about 18 percent, then a bounce back up, and then another decline, but the market subsequently recovered and went on to new highs for the year. The decline started on July 17, and the market hit a new high on November 27, just over four months later.
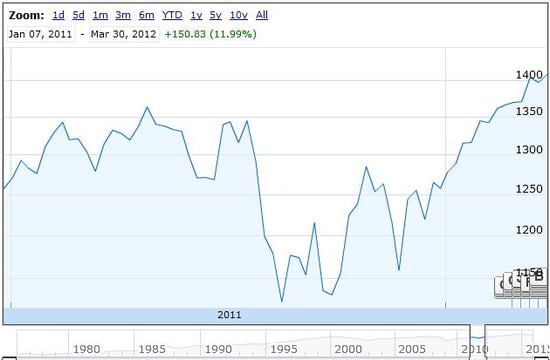
Now let’s look at the S&P 500 in 2011. (Note that this chart extends into 2012.)

Source: Google Finance
Just as in 1998, we saw a decline, from peak to trough, of about 18 percent, then a bounce back up and another decline, but the market subsequently rebounded to new highs. The decline started on April 29, and the market hit a new high on February 24, just under 10 months later.
In both cases, the damage was worse than what we’ve seen so far; yesterday bottomed out with a loss of just under 15 percent from the peak. In both cases, an initial recovery was followed by a drop back to close to the lows. And, in both cases, we saw a relatively rapid recovery.
How soon we forget . . .
Both of these crises happened when the underlying economy was reasonably solid, so the reason for the price decline was a collapse in confidence. I would argue that we’re in a similar situation now. Given the solid U.S. economy (which is more stable now than in 2011), China’s much greater resources (both political and financial) than in 1998, and the simple fact that, having weathered one crisis, we’re much more prepared to respond to another, it's hard to make the case for an event worse than either of those years.
That’s not to say we might not see another pullback—we did, after all, in 1998 and 2011—but that the longer-term effects should not be significant.
Recently, I’ve given several talks to investors where I ask, “Do you remember the stock market crash of 2011?” Most of the time, the question is met with blank looks. The lesson here is that if you don’t remember the 2011 decline, you won’t remember this one in five years either.


 Print
Print


