

 Print
Print I’ve been away speaking at Commonwealth conferences for the past 10 days, which were (as usual) a tremendous amount of fun. I even had the chance to take my parents to the last one, in Naples, Florida. They found—and I rediscovered—that there’s no nicer group of people than Commonwealth advisors and staff. I’m tremendously grateful for the opportunity to hang out with these folks, and to show my parents my world.
My conference talk on Sunday morning opened with the quip that I was “preaching a sermon from the book of jobs.” It took a minute for everyone to get it—Sunday mornings being a tough time to listen to an economics lecture—but it did prompt a laugh. Beyond the joke, though, the idea conveys a fundamental reality of the current recovery: what drives the U.S. economy is jobs.
That consumer spending represents more than two-thirds of the economy is common knowledge; the corollary is that consumer spending comes from consumer income, which comes from jobs. If jobs are doing well, the rest of the economy will eventually do well. And, of course, the converse is true as well. This is why employment is a key indicator in my monthly economic update. To understand the economy, we have to understand the jobs picture.
A positive jobs outlook
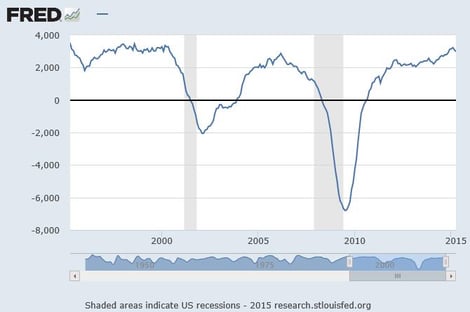
As I’ve written before, in the past 12 months, the U.S. has created more jobs than in any 12-month period in the 2000s, and more than at any point since 2000, as you can see in the chart below. Not only that, initial unemployment claims—job losses—are at all-time lows, as a proportion of the labor force. Job creation and job retention are both approaching boom levels.
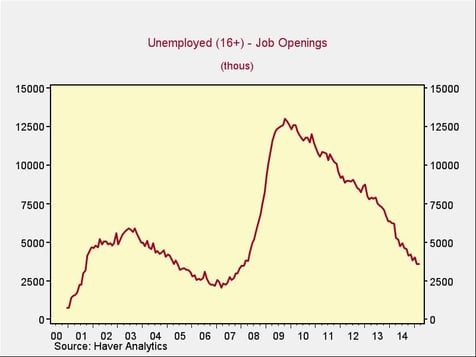
Job openings are equally robust, with available jobs at a higher level than at any time in the 2000s, and at the highest level since 2000. If we subtract the available job openings from the total number of people who are unemployed, we’re back to pre-crisis levels.
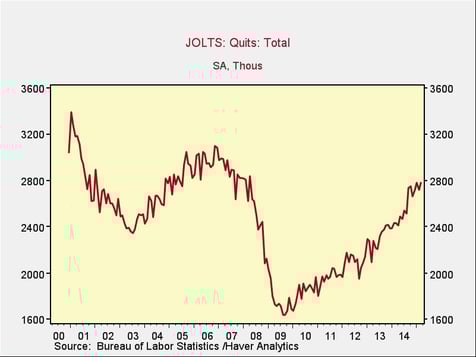
Finally, looking at the number of people voluntarily quitting their jobs, we see that, once again, we’re at levels that indicate high confidence, consistent with a very strong year like 2005.
But are they good jobs?
Despite all the good news summarized above, the question remains in many minds of whether these are good jobs. That’s a very reasonable concern, so let’s consider both part-time/full-time and the type of jobs.
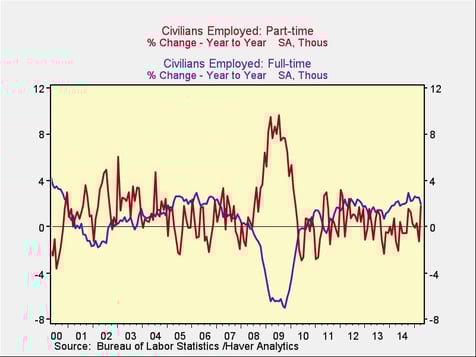
As you can see in the chart below, although part-time jobs spiked and full-time jobs plunged during the crisis, full-time jobs have since grown significantly, and part-time jobs have actually declined in many periods. On a net basis, almost all of the jobs created in the past several years have been full-time.
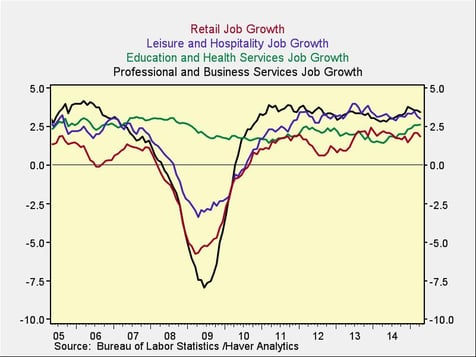
Looking at the type of jobs that are being created is a bit more complicated. I chose to take the two highest-paying sectors, education/health and professional services, and compare them with the two lowest-paying, retail and leisure/hospitality. You can see the plunge in job creation during the crisis, but comparing right now with 10 years ago shows that job growth is almost identical in all four sectors. If you were happy with job growth in 2005, you should also be happy now.
What all this means, of course, is that despite short-term corrections and poor data points, the engine driving the economy continues to be strong. Reading the economy really is like looking at the book of jobs. Going forward, this will be the key factor in whether the recovery continues.


