 There is a lot of economic data coming out this week: consumer confidence, third-quarter economic growth, personal income and spending, the ISM Manufacturing number, the jobs report on Friday, and, of course, the Fed’s decision on interest rates (which, if you haven't heard, resulted in another quarter-point cut this afternoon). We will get a much better understanding of where we are by the end of the week, and we will talk about what all that data means.
To some extent, though, we need to step back from the trees of the data and look at the forest of what the economy means to us as investors. Today is a good time to do just that. We are 10 months through the year, and we now have a read on the economy through the first 9 months. Although the rest of this week’s data will shape our perceptions, much of this year is already done. We can now take a look back and think about what the rest of this year and next year will look like.
Growth trending down
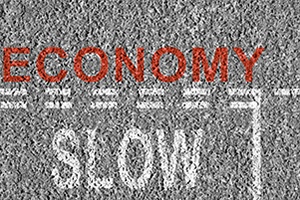
The first point is that growth has slowed. This fact is nothing new, as growth has been trending down. In fact, last quarter was somewhat better than expected. Still, growth is slowing, and any analysis we do has to reflect that trend.
Slowing growth alone, in fact, explains much of what is going on—and what is likely to happen next. The Fed has cut rates and is expected to do so again today because of slowing growth. Hiring has lessened, at least in part, because of slowing growth. Business investment is down because of slowing growth. Slowing growth is the defining economic story today.
Despite that story, growth has not slowed nearly as much as feared. Year-on-year growth is still holding at close to levels we have seen throughout much of this cycle. Despite the concerns above, growth has held for two main reasons. First, government spending has increased. Second, consumers have continued to spend. Whether growth continues depends largely on these two items.
Slowing growth gives us some context around this problem. Consumer spending, for example, depends on job growth (which is slowing) and consumer confidence (which, although trending down, remains at a high level). Government spending, on the other hand, tends to rise as the economy slows, so this dynamic should give us some cushion. Overall, slowing looks likely to continue—but slowing is still growing.
Slowing growth is also a reasonable paradigm for what we will see going forward. Right now, there is no immediate reason for the economy to drop down into an actual recession, but there are reasons to expect growth to stay slow. Similarly, there are no real reasons for growth to pick up.
Overall, slow growth is not a bad place to be. Current growth levels, while slower than they have been, are pretty much at the levels we have seen for almost all of this recovery. Slow growth can keep going, while faster growth can flame out.
What’s the big picture?
The big picture, then, is that while growth is slowing, slowing is still growing. The risks are material but haven’t yet hit the red light zone. Slow growth can keep going for quite a while, as we have seen over and over in this cycle.
Big picture? Pay attention. But slow growth is better than no growth.


 Print
Print

