

 Print
Print Yesterday, the market sell-off continued, reportedly driven by a higher-than-expected inflation report and a comment by St. Louis Fed President James Bullard that he wanted to hike rates even faster than the market had been expecting. For a market that was already nervous about inflation and rates, it was a one-two punch. The Fed is being forced to act, by inflation, and at least one Fed member is very willing to hike rates quickly in response.
And the fixed income market responded, with U.S. Treasury yields rising sharply. The increase was so sharp, in fact, that market analysts are comparing it to the taper tantrum, an infamous episode from 2013. At the time, then-Fed chair Ben Bernanke said midyear that the Fed was thinking about tapering its asset purchases, and markets reacted by pushing yields on the 10-year Treasury debt up from around 2 percent to around 3 percent by the end of the year. That is a big jump, of about half, in a relatively short time, which is unusual in fixed income markets.
Now, the behavior of yields looks quite a bit like the taper tantrum. So, is this taper tantrum part 2—and what would that mean for future policy?
First, Some Context
As always, the first thing we need to do is set the context. The chart below shows the yield on the 10-year Treasury note. You can see the taper tantrum increase in 2013: it was indeed a sharp increase in a fairly short amount of time. But by putting it in context, we can also see that something very similar happened in 2016. And in 2017. And in 2020–2021. In all of those cases, yields rose by about one percentage point over a period of several months. For all the commentary about the taper tantrum, that kind of move in yields has happened every couple of years over the past decade. It simply has not been unusual.
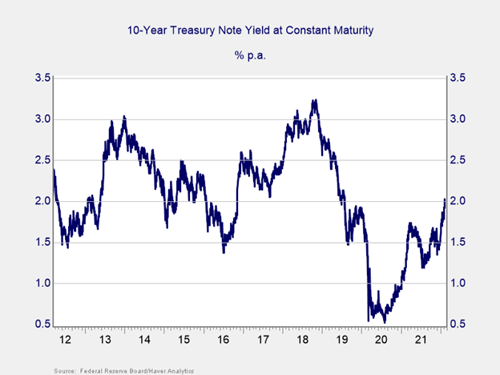
Looking at this chart, we can also draw another conclusion, which is that yields tend to adjust sharply and quickly when they are far from the central tendency. Yields have mostly been between 2 and 3 percent over the past decade. When they are pushed down, they tend to bounce back up. When they get too high, they tend to drop, although a bit more slowly. Looking at this chart, yields seem to want to move back to that central range, unless central banks force them one way or another. And when the central bank takes its thumb off the scales, rates bounce back.
This brings us back to the present. As the Fed is now normalizing policy, by eliminating asset purchases, we would expect long-term rates to increase. As the Fed raises short-term rates thereafter, we would expect long-term rates to increase. In other words, what we are seeing—rate increases on the 10-year U.S. Treasury—makes sense given the recent performance of both policy and the economy as a whole. More normal interest rates reflect a more normal economy, which is what we want.
Will the Stock Market Be Derailed?
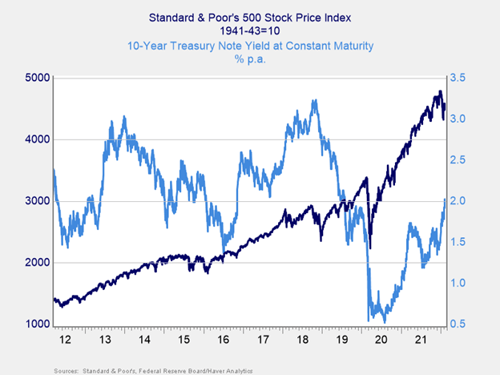
That leaves us with one primary question: what does this mean for the stock market? Here, too, we can set the context per the chart below. As we can see, the multiple sharp increases we saw never derailed the market’s rise over time. It can happen, certainly, but it has not happened in the past decade. Rates in the central range, to which the market is now returning, have allowed the market to keep going up.
Nothing to Worry About?
So, is this another taper tantrum? It sure looks like it. Should we care? Not at this point, as history shows that while sharp increases can create volatility, they have not derailed market expansions in the past decade. As long as rate increases are driven by faster growth, and rates remain in the sweet spot, the current increases are nothing to worry about.
That said, those are two big assumptions. And we will discuss them next week.


