

 Print
Print It has been a difficult couple of months in the stock market—and things have only gotten worse over the past couple of weeks. After the drop in early February, which took the S&P 500 down by almost 9 percent from the all-time high, the market bounced back. But it started dropping again in mid-March, which takes us to where we are right now: down 9.6 percent from early February.
Put in this context, the current decline—while scary—doesn’t even meet the definition of a correction (i.e., a decline of 10 percent). It is close, yes, but not there. Indeed, corrections are typically just that—simply a pause rather than something worse. So, as scary as the market action has been, the damage thus far is not actually all that bad. Something to keep in mind.
200-day moving average
Still, there is reason to pay attention. As I have said multiple times, I start to pay attention when the market cracks its 200-day moving average. We did just that on April 2, for the first time since June 2016. This break of a long-term trend line is definitely something worth noting, as it doesn’t happen that often—and it can be a sign of more trouble ahead.
Here again, though, this is a reason to pay attention but not to panic. The market broke through the trend line in June 2016, only to bounce back up. Looking at the past 10 years, we can see that there have been multiple breaks, some lasting for months. Ultimately, however, the market bounced back and moved higher.
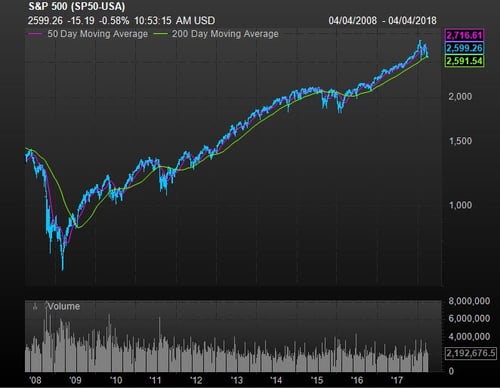
Looking at the chart above, we saw breaks in 2016 (remember that?) and in 2015, both lasting for months. We also saw quick breaks in 2014 and 2012. And, of course, we saw long breaks in 2011 and 2010. But the past seven breaks below the 200-day trend line have been false alarms rather than signals of something worse. Chances are that this one is a false alarm as well—but maybe not. How will we know if this is a false alarm or likely to turn worse?
Could things get worse?
First, let’s define “worse.” I would call a long-lasting bear market, defined as a decline of 20 percent or more (e.g., in 2000 or 2008), a pretty good definition of what I am worried about. What would it take to get there?
In both of those cases, the break through the trend line was also associated with a recession. In fact, this is the case for almost all bear markets. Although 1987 and 1962 are the exceptions here, a recession is the major risk factor we need to watch that would turn a trend line breakthrough into something worse. If a recession were imminent or even a serious risk, that would significantly raise the chances that this break could get worse.
Fortunately, while the economy may be slowing, it is still growing and at a reasonably healthy pace. Hiring and confidence are strong, and spending continues to grow. Because of the supportive fundamentals, chances of a recession remain small. As such, the likelihood is that this will be another false alarm.
Will confidence continue?
That is not to say there is no risk at all. While the fundamentals are outside the worry zone for a recession, the real question here is confidence. Up until recently, there was a high degree of confidence that the economy was growing, that companies were making more money, and that the market was solid. That led to steady appreciation and ensured that the dips were small and short lived. The question going forward is whether that confidence will continue. Even in the absence of a recession, a break in confidence could lead to a worse decline in the market.
How can we spot a likely confidence break? We will discuss that tomorrow.


