

 Print
Print Yesterday saw another significant drop in stock markets, more than reversing the bounce we saw the prior day. Up, down, up, down, but largely down—it looks like the market is headed down indefinitely.
Yet, if you look at the S&P 500, we are about where we were a year ago. That is not great, but it’s certainly not the end of the world. If you look at recent highs, we are down about 14 percent from the peak. Again, this is nothing to cheer about, but it’s not especially bad in the historical context.
Is There an End in Sight?
Markets bounce around. No one minds the up bounces, but the down bounces hurt (a lot). And reminders to focus on the long term often don’t really help. So, let’s look at the question in another way: what should the market be worth? If we believe that stock prices are determined by fundamentals, which over time can be demonstrated, then there should be a central value that stocks trade around. If we can estimate that, then we can watch the downswings (and the upswings) with a bit more equanimity. That is the question I want to look at: what should the S&P 500 be worth—and is there a bottom in sight?
You can really go down the rabbit hole here. For today, I want to do a simple analysis based on three factors: interest rates, stock valuation multiples (also known as P/E ratios), and earnings. If we look at these three things, we can get some insight into where stock prices should be and, therefore, where they are likely to end up.
Interest Rates and Valuations
Let’s start with interest rates and valuations. This chart looks at the interest rate on the 10-year U.S. Treasury note and compares that with the price-to-operating earnings ratio for the S&P 500, based on the last 12 months of earnings. You can see that, generally, higher interest rates mean lower valuations. With interest rates rising, we should see the market going down. So, where will valuations end up?
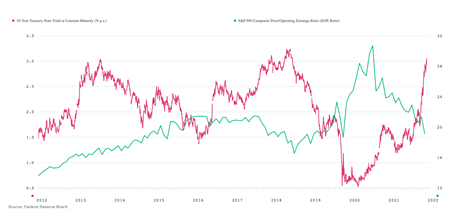
For simplicity’s sake, let’s just look at the last two times interest rates were at current levels, in 2013–2014 and the end of 2018. In both cases, the S&P traded at around 18 times trailing operating earnings. If the relationship holds (and it should), we should see it bottom out around that level this time as well.
Earnings
Let’s look at the data. For the four quarters of 2021, the total operating earnings were $208.21. So far, for the first quarter of this year, earnings are up by about $5.00 from the first quarter of last year, which is not final but pretty close. If we use that, then the trailing 12-month earnings for the S&P 500 would be about $213, which means the S&P 500 should, on this basis, be worth around 3,850. Based on the past results, that is where the index should bottom, if the decline continues. In other words, we may have another 7 percent or so to go.
Note, though, that in both cases valuations then rebounded. If history holds, that would be a bottom. Also note that we might well not get that low; other metrics suggest higher support levels. Finally, note that as earnings increase over time, even at lower valuation levels, the market can and will rise. The actual number, of course, is an estimate. But the real message here is that we are approaching a solid value foundation—and that will limit any further declines.
Back to Normal?
The other reason not to panic is that the reason this is happening is positive, not negative. Economic conditions are normalizing, which is what we have been working toward for years. As part of that, so are interest rates. Finally, as interest rates normalize, so are market valuations. All necessary and ultimately positive.
Per the chart above, valuations have been at very high levels and are now moving back to normal. Per the chart above, interest rates are doing the same thing. This is painful in the short term, but it will set the stage for future growth.
It also provides us with the assurance that the market is not irrational and is not on an unending downward slide. We may (I repeat may) have more of a decline ahead of us, but it will be limited. More, it will still be well within the adjustments we see almost every year. Like most medical procedures, this is no fun but will ultimately end and leave us in a better place.
Detour Ahead
If you understand where you are going, you know what it takes to get there. This analysis is intended to show us both. This is part of the healing process. We will get back to growth—we just have to take a bit of a detour first.


