

 Print
Print In the last post, we laid out both the U.S. imperative (keep the status quo and improve it if possible) and the Chinese imperative (make a successful economic transition to a developed, wealthy economy). We also outlined how China has changed its strategy from what has been so successful over the past 40 years, and we closed with a teaser on the U.S. response.
Before we get to that, however, we need some more context. Any conflict, and the moves therein, depends on the relative balance of forces and the available moves at any state of play. We looked at the military aspects of that, briefly, to determine that the U.S. still remains a commanding advantage and, therefore, China is unlikely to resort to military action. Whether the U.S. has a similar—or any—advantage in the economic context is not nearly as clear. To figure that out, let’s look at different metrics, starting with population.
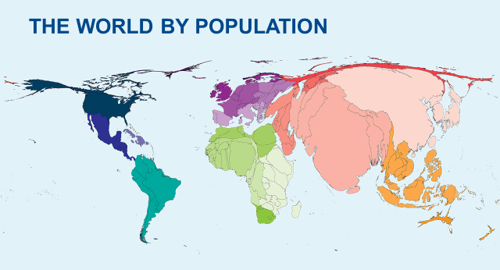
Population
People, as the saying goes, are our most important resource. Here, the U.S. is well behind China and India. From a sheer population-based perspective, the U.S. is clearly outgunned.
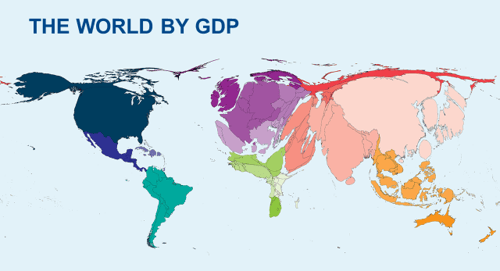
Economic size
People, however, are not productive in and of themselves. They require capital, education, and everything else that goes with being a modern economy. As such, looking at economic size is a more effective way to compare powers. In the chart below, you can see that China remains impressive but that the U.S. is clearly competitive, as is Europe as a whole. India, surprisingly, is also a large part of the map, which raises a significant point. For economic power, it is not just the size of the economy that matters—it is the structure and how it interacts with the rest of the world. For all the size of India’s economy, it is not (yet) a significant global player.
Internal structure
The next chart shows the economic structure in a more organized way. Here, we can see relative economic sizes but also the internal structure of each country at a high level. We can see better the comparative size, broken down by geography. Note also the differences between the two charts: economic measurement is not an exact science. Also note that this chart still does not account for relationships between economies, which is where power and competition occur.
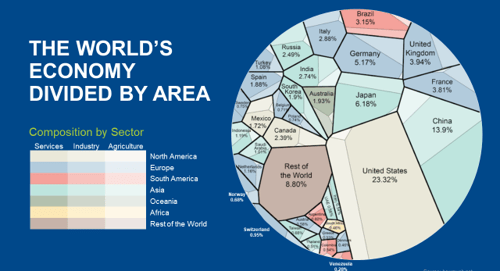
Source: howmuch.net
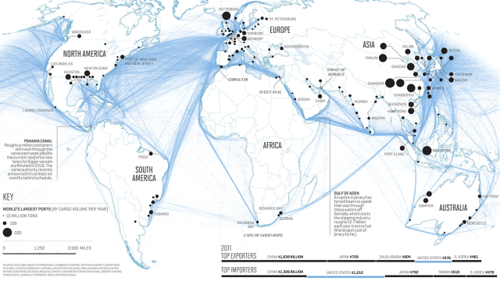
Trade
An effective way to visualize those relationships is to look at trade routes and ports. For trade in goods, you have to ship. Below, you can see clearly that Asia and Europe, in that order, dominate the ports and trade map. The U.S., for all the size of its economy, is relatively port poor, as are India and Russia. So, trade is not necessarily the ideal lens either.
Supply and demand
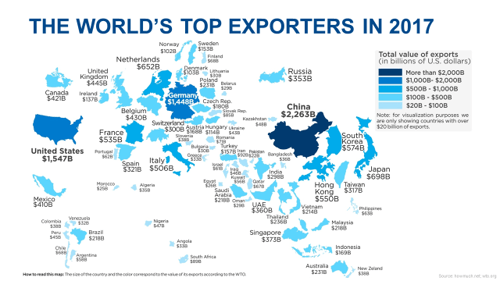
What we can do is combine all of these to create a classic economic lens, where we look at supply and demand. In any economic relationship, that is what determines relative influence and power. Next, you see a map of the leading exporters, which closely maps to the port/trade route map above. Put one way, these are the export superpowers, with a rising China and Asia generally and Germany taking pride of place. The U.S., while a significant presence, exports only slightly more than Germany and about one-third less than China. From an export perspective, China and Europe clearly have the edge in any power contest.
That is the supply lens, however. If we look at imports (i.e., the demand side), the picture is very different. On an aggregate level, the U.S. is now the largest source of demand—the biggest customer. While China and Germany are large as well, the difference is larger than it looks, as much of their imports are then reexported. In terms of final demand, the U.S. is by far the largest buyer in the world.
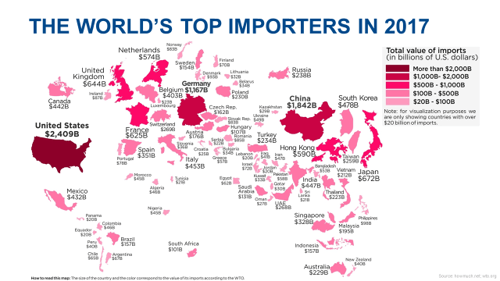
When we look at the rising competition, then, the exporter lens doesn’t demonstrate power but, rather, vulnerability. Customers ultimately control whether they buy or not, and sellers are at the mercy of that demand, which largely comes from the U.S.
The indispensable market
This story is not new, of course. As we started the series with, open access to the U.S. market, and U.S. demand, has been the engine of global economic growth since the end of World War II. U.S. spending is what brought Europe’s and Japan’s economies back from wartime devastation and what allowed China to grow the way it has. The U.S. has been the indispensable market, the one that everyone else wanted and needed to sell to.
What about Europe?
In fact, that indispensability is the ultimate foundation of the Trump administration’s trade strategy: that China will ultimately have to bend simply because its economy depends on the U.S. market. It has no alternative. The question at hand is whether that remains the case. And what about Europe? We will take a look at that next.


