

 Print
Print The bad news this past week is that the chances of a national second wave of infections are increasing as localized outbreaks in several states continue to get worse. The states in question are Arizona, California, Florida, and Texas, with the Carolinas also under pressure. All have shown significant spikes in cases in recent days. Multiple other states are also seeing expanded case growth, although not yet at the levels of those four. While the virus remains under control in many states, the breadth and magnitude of the outbreaks continue to increase the risk at a national level.
For example, as of June 24, the four states most affected (Texas, Florida, Arizona, and California) reported 20,247 new cases, up by 67 percent over the prior week. At the same time, new cases elsewhere were up by 28 percent. While the four headline states are showing more infections, the case growth in the rest of the country is also substantial. Supporting the idea that national risks are rising is that the rate of positive tests has ticked up substantially.
On the other hand, there is some good news. The economic reopening is still on track as consumers move back into the economy—although that may be at risk as local restrictions come back into play. Further, last week’s data showed that housing continued to be strong and that the first quarter was better than expected.
Overall, from a medical perspective, the virus remains under control at a national level, but conditions are deteriorating and the risks are rising. From an economic perspective, the news remains good as the reopening continues.
Let’s take a look at the details.
Pandemic growth picks up
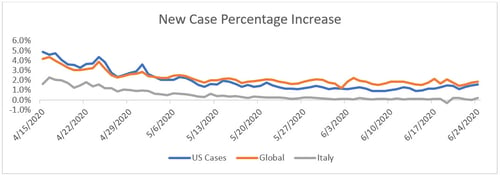
Growth rate. Over the past week, the daily case growth rate has trended up from 1.2 percent to 1.6 percent per day, due to significant accelerations in several states. At this rate, the case-doubling period has dropped from about 60 days to about 45 days. This rate leaves the virus under control and the curve fairly flat at a national level. But several states are now showing substantially higher growth rates that could threaten their health care systems. This is a rising risk in those states.
Source: Data from worldometer.com
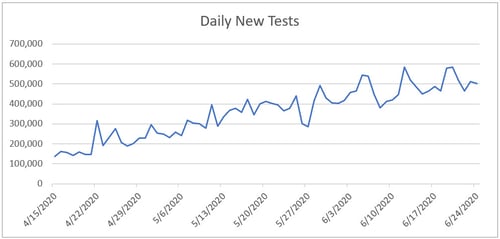
Daily testing rate. After a drop, testing rates recovered in past days and seem to be steady at around 500,000 per day. The stabilization of testing is bad news, as it is not yet at the level needed to develop a full understanding of the pandemic, despite the outbreaks in multiple states.
Source: Data from the COVID Tracking Project
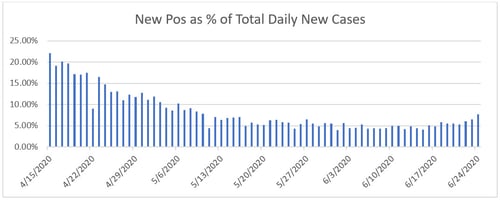
Positive test results. Another way of seeing this lack of progress is to look at the percentage of each day’s tests that are positive. Ideally, this number would be low, as we want to be testing everyone and not just those who are obviously sick. The lower this number gets, the wider the testing is getting. Here, we can see that the positive level has started to trend up, suggesting that we are getting back to the point of just testing the people who are sick. Again, this increase is likely due to the effects of the state-level outbreaks.
Source: Data from the COVID Tracking Project
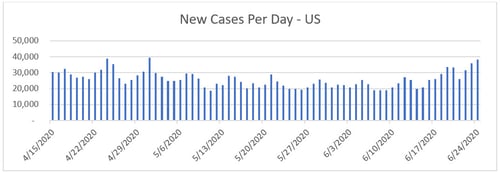
New cases per day. The most obvious metric for tracking the virus is daily new cases. Due to the state-level outbreaks, the number of new cases per day has edged up to just under 40,000 per day. This number is close to the high point for the pandemic thus far and well above the range of the past several weeks. It is also somewhat better than it looks at a national level, as it includes the effects of the outbreak states. Still, it’s not much better, as we are also seeing accelerated case growth in many other states. As noted earlier, the new cases are largely from the outbreak states, but the rest of the country has also shown a substantial acceleration in new cases. The national numbers are no longer just about a handful of states.
Source: Data from worldometer.com
Total active cases. Active case growth has also ticked up over the past week and has moved above the prior peak. New infections are now outpacing recoveries, indicating that the burden on the health care system is getting worse.
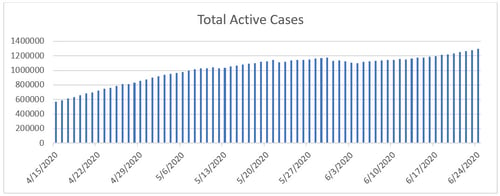
Source: Data from worldometer.com
Major state outbreaks have risen to the level of threatening local health care systems, and case growth in other states is also accelerating. Overall, while the pandemic continues to be largely under control at the national level, the increasing breadth and speed of the state-level outbreaks are something we need to watch closely.
Despite outbreaks, economic reopening continues
Job market. While layoffs continue to decline, they are doing so by less than expected. This suggests either that the damage is spreading beyond the initial sectors affected or that the state-level outbreaks have started to show up in the employment data. In better news, the continuing unemployment claims have continued to decline. They remain well below the recent high, despite the continuing layoffs, suggesting many people are starting to move back to work.
Also supporting this idea was the most recent employment report, which showed 2.5 million jobs created on a net basis in May, above the 7.5 million losses expected. As this report represents actual payrolls, it is a solid indicator that the job market is now improving. While there are some questions about the details of the data, the direction—improvement—seems to be holding.
Consumers on the move. We also see this improvement in many other indicators. The most recent retail sales report showed spending up by 17.7 percent, well above expectations, as consumers return to work and shopping. The chart below illustrates higher-frequency spending data, showing consumer spending down by 8.9 percent from January, which is an improvement from the 11.3 percent decline last week. This improvement supports the retail sales report and shows that economic progress continues despite the rising infection rate.
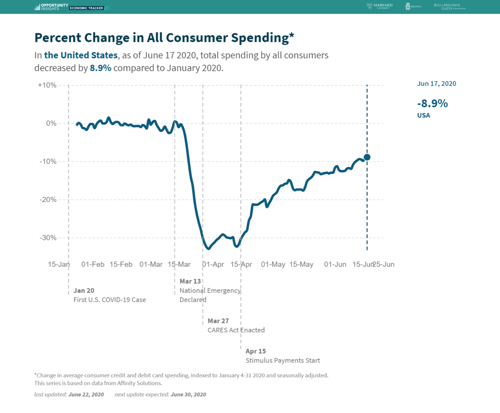
Source: tracktherecovery.org
And finally, we can see this terrific composite of many indicators from J. P. Morgan showing the substantial recovery in many metrics, which continues despite the outbreaks.
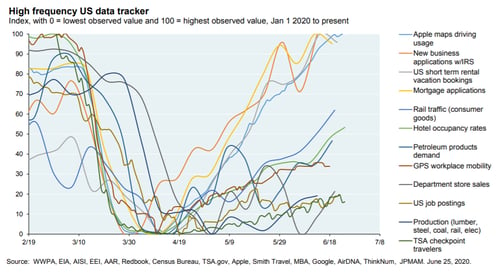
Source: J. P. Morgan
The risks. Although the reopening is going better than expected and is clearly having some positive economic effects, we certainly face risks as we reopen. The biggest of these is if the local outbreaks turn into a national second large wave of the pandemic. At this point, that is not the case, but it is an increasingly likely possibility.
Another potential risk is that, even with the reopening, consumers will be slow to return and spending growth will not return to what was normal any time soon. This outcome seems possible, although the signs remain positive, as we have not yet seen a decline in spending due to the outbreaks.
Financial markets volatile on pandemic news
For the financial markets, we continue to see volatility around fears of local outbreaks going national, but markets remain supported by the ongoing positive economic news. While risks remain, the good news is that as we get more data, markets could end up with a much firmer foundation. Overall, the medical news has been showing rising risks, so far the economic data has been positive on the whole, and markets have responded.
Virus still a major risk
The real takeaway from this past week is that the virus continues to be the major risk. If the outbreaks continue to worsen and spread, it could put the recovery at risk—but so far we do not see that. The most likely case appears to be continued recovery, despite the rising medical risks.
Also supporting that idea is the fact that states with outbreaks are starting to take the necessary measures to control the outbreaks. We will certainly see more damage, but the playbook to bring the outbreaks under control was well established earlier in the pandemic and just needs to be implemented. As states do so, we should see the outbreaks subside.
Risks are rising, and we are not yet out of the woods. There are certainly significant risks going forward, with localized outbreaks turning into a national second wave being the most significant. At the same time, in some sense this situation was inevitable and just part of a necessary process to figure out how to reopen effectively while still keeping the virus under control. Even as we go through that learning process (with the consequent pain), the thing to keep in mind is that many of the biggest risks are still moving behind us.


