 Today seems like a good time to pull out the wayback machine again, for a look at commodity and oil prices. I’ve focused quite a bit on oil prices here, and what they might mean for the U.S. economy, but other commodities are also important.
Note that we’ll be looking at real prices in this post. Although commodities (and everything else) are priced in nominal dollars, we need to remove the effects of inflation in order to make valid comparisons over the time frames we’re talking about. The previous two wayback posts, on employment and interest rates, didn’t present this problem. But for anything dealing with prices, we have to account for inflation, so the numbers here may look a bit different from what you remember.
Real oil prices seem to be normalizing
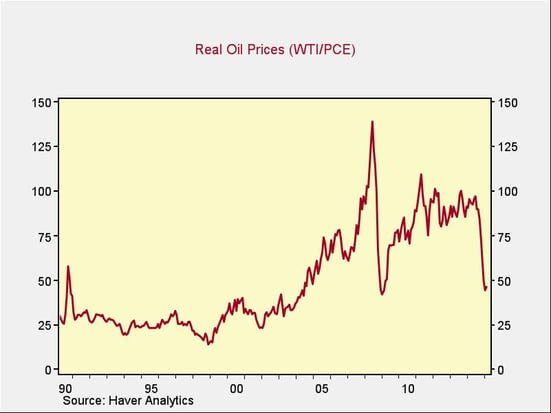
As of today, West Texas Intermediate prices are around $46 per barrel. (I’m using approximate figures, as, of course, they vary.) Oil was around $74 per barrel 5 years ago; 10 years ago, it was around $57; 15 years ago, around $37; 20 years ago, around $25; and 25 years ago, around $31.

Remember, these prices are in real terms, adjusted for inflation, so we can see a couple of things:
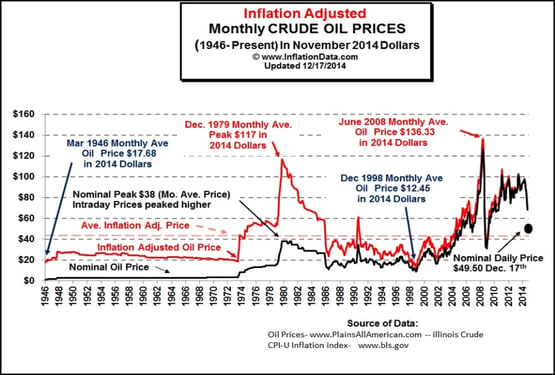
- Even though oil looks cheap in terms of the past 10 years, it’s still fairly expensive when you look further back. Any discussion about how cheap oil will change the world should factor in the 2000s and the 1990s, as oil was even cheaper then.
- If anything, it’s the run-up from 2004 through last year that looks abnormal. In many ways, current oil prices are just moving back to normal levels, from an economic perspective. You can see this more clearly in the annotated, but slightly less current, chart below.

Ditto for other commodities
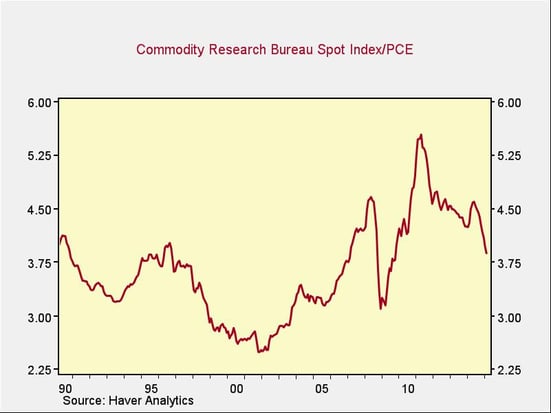
When we look at other commodities, we see roughly the same thing, per the chart below.

Here, there was more volatility from 1990 to 2005 than in oil (but still a general range in which commodities traded), then run-ups in the late 2000s and early 2010s, followed by a decline back to where prices were in previous decades.
What’s driving this?
The first answer is that it almost doesn’t matter. Prices are what they are, and what we see is that they’re moving back to normal levels.
For the future, though, it does matter, and I would say that two trends were responsible for driving prices higher:
- Financialization. Investors rather than users were buying commodities, which created a much larger and price-insensitive group of buyers. No wonder prices were bid up! This group of buyers, however, is ultimately constrained by reality, as higher prices inevitably give rise to more supply, which can explain both the run-up and the decline, especially in oil.
- The rise of China. With today’s lower Chinese growth rate and the planned shift from construction to consumption, Chinese demand should remain lower than in the boom years—which also explains both the boom and bust in commodity prices over the past couple of decades.
Absent these one-time factors, we are probably moving back to a calmer environment for oil and commodity prices. This should help moderate both inflation and deflation, as well as enable businesses to plan better and more effectively.
What it will not do is substantially change how the economy operates, for better or worse, but simply take us back to a more stable environment—which, come to think of it, should be a force for good.


 Print
Print

