

 Print
Print As I mentioned yesterday, one of the key data points that will determine whether we get a recession sometime next year is whether job growth continues. Tomorrow, we get the November 2019 jobs report. This report is a big one—not only for the economic impact but also for the potential market impact on whether we will really see a Santa Claus rally.
What’s expected?
Expectations are quite strong: for a gain of 170,000 for November, up from 128,000 in October. That gain includes the return to work of 45,000 workers from the strike at General Motors (GM), though. So, it isn’t quite as strong as it looks—but would still mean that jobs are growing faster than the labor supply. It would also keep the three-month average job gain at around 175,000, which is up from the 150,000 average during the summer. If we get something like the expected gains, that would be very positive for the economy and the markets through the rest of the year.
Looking under the hood, however, that 170,000 includes the GM strike returnees, which are not really new jobs. If we adjust last month by adding in the striking workers, and adjust this month by subtracting them (since they would not be new jobs), we get a pullback from 173,000 to about 125,000. That result doesn’t look nearly as good. That slowdown seems to be the real story, even if we match expectations.
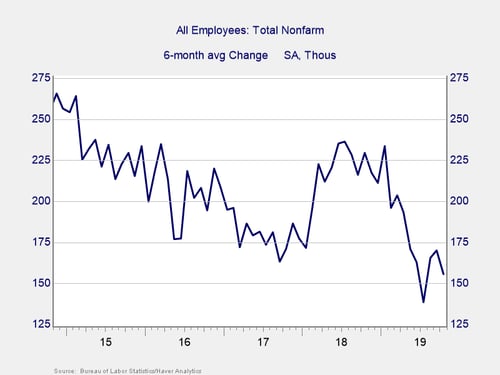
In fact, if we look at the six-month average change over the past five years, we can see a clear downward trend until 2018, when job growth spiked up. In 2019, however, growth dropped again down to the earlier trend line. If November’s job growth is around expectations, that would leave the average holding above the trend line, which would be positive. If not, it suggests job growth may continue to revert to that downward trend line. There is some real downside risk here.
The other side of the story: The household survey
There is, however, another side to the story. There are two employment surveys that feed into the jobs report: one for businesses and one for households. Generally speaking, the two are in line. But over the past several years, there has been a disconnect.
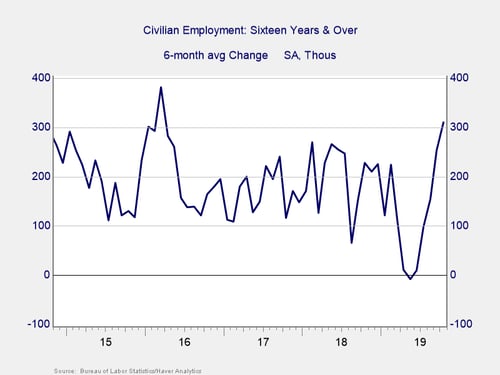
The chart below is the same as the first one, but using the household survey. Here, you can see that job growth has been much more consistent over the past several years, without the downward trend we saw in the first chart. There has been significant variability, true. But, in general, the trend has been steady. This survey suggests that while there may be a downward trend, it is not as apparent at the household level. Thus, the economic damage of the trend might be less than expected.
A deeper look at the data
As we move toward an economic turning point, it is important to keep an eye on different indicators. In the case of the jobs report, we have largely been able to rely on the establishment (business) survey for the recovery. But we now need to spend time looking deeper into other data, of which the household survey is the most important.
Right now, we can expect the headline jobs number (from the establishment survey) to come in around expectations—and that will be positive. Beyond that, however, we will also take a look at what the household survey has to say, as well as other indicators.
Big picture? The trend may be weakening. But even if the jobs report disappoints, there is reason to believe it may not be nearly as bad as it looks.


