

 Print
Print Yesterday was another bad one for the market, with the S&P 500 down more than 2 percent. The S&P as a whole is now down more than 8 percent from the peak, with the Dow down about 5 percent, and the Nasdaq down more than 13 percent as of this writing. What is going on—and will it get worse?
Typical Volatility?
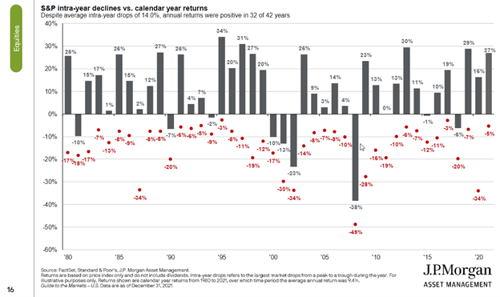
As always, first let’s provide a little context. The volatility we have seen so far is typical and usually occurs every year or so. The chart below illustrates that pattern very clearly. With the S&P down about 8 percent, it is still below the average decline over the past 10 years, at around 10 percent. Right now, it looks scary—but is actually quite normal.
Bigger Declines Ahead?
That doesn’t mean it can’t get worse, of course. That 10 percent average includes five years where the markets dipped by more than 10 percent, including drops of 20 and 34 percent. We could see a bigger decline. But even with those larger intra-year drops, the annual numbers look much better. A sharp decline during the year, far from being a sign of trouble, has often led to year-end gains.
Another sign that things could get worse is that the S&P Index is now bouncing around below its 200-day moving average. This is a long-term trend line for prices that often acts as a support for the index. When it gets broken (as it has), the risks of a further decline go up. Note that the odds remain in our favor, as about two of three times the index recovers quickly, but the risks have definitely gone up a bit.
And that makes sense, given everything that is going on. Between the Fed raising rates, inflation, Ukraine, and on and on, more volatility in response to the news, as well as the real risks, is something we should expect.
What Can Investors Do?
But that doesn’t mean we should do anything about it. If you look at the chart above, even the worst years finished well above the drawdown levels. 2020 was down 34 percent at its worst but finished up 16 percent. The usual pattern is for an intra-year loss, but a full-year gain. And even the worst years are typically a prelude to better returns going forward.
Selling into a downturn has historically been a bad idea. Right now, with a modest downturn that is normal by historical standards, I see no reason to act. Even if the downturn gets worse, which it might, the markets still have a substantial cushion based on strong earnings growth, as we have discussed before.
Analyze, Don’t Panic
It is still a scary time, so is there anything investors can do? There is, especially if they are nervous. What the current pullback has given us is a chance to evaluate our portfolios and see whether we are really comfortable with the risk levels. If not—and if you are nervous and not really comfortable—now is a good time for investors to talk with their advisors to make sure they can ride out any volatility. They should take a look at their holdings and make sure they are prepared to ride out the turbulence.
In other words, to do something, analyze—but don’t panic. And that is advice that never gets old.


