 Yesterday, we saw the largest stock market drop of the year. The Dow Jones Industrial Average was down more than 800 points (over 3 percent), an even bigger decline than we saw earlier this month. Plus, we are on track for the worst week of the year. It is a tough time for markets, and investors are worried. But should they be?
What’s behind the latest turbulence?
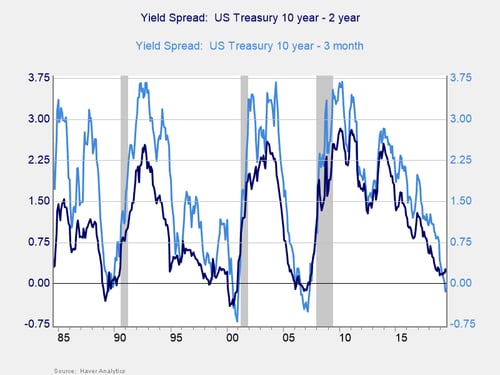
The latest round of turbulence has been driven by two things. First, the yield curve for U.S. Treasuries inverted. Specifically, the yield on the 10-year note dropped below that of the 2-year note, which is often a leading indicator of recession. Second, there are signs of slowing growth around the world, especially in Germany and China, two major exporting countries. Combined, these factors may suggest the real possibility of a global recession. Or, of course, they may not. At this point, the outcome is uncertain, and the market is struggling to figure out what is going to happen.
We have seen this reaction before, as markets try to price in the news. Although the recent drop is worrying, it is also normal. In fact, it is consistent with the market’s rational efforts to price in the effects of both a slowing economy—not a recession—as well as the ongoing trade confrontation. As we saw earlier this month, when news hits, markets typically sell off but then may recover. As long as the response is rational, then markets are working as they should. This perspective gives us a way to look at the effect of the latest news to see whether it will have a longer-term impact.
Yield curve inversion
First, let’s consider the yield curve inversion, which has been all over the headlines. When shorter-term interest rates are higher than longer-term rates, it is typically a sign of pending economic trouble. With the interest rate on 10-year U.S. bonds now below that of 2-year bonds, there is indeed a reason to be concerned—and this no doubt was a factor in yesterday’s drop.

If we look at the data, however, we realize that the yield curve has been inverted on a 10-year/3-month basis for some time now (as shown by the light blue line in the chart above). We should also consider that when an inversion occurs, there is usually a delay of two years or so before a recession starts. Finally, we know that, historically, an inversion has to last for months to be a real signal, and the 10/2 inversion has not even lasted days. Worst case, based on history, we have a recession coming sometime in the next one to two years. This is not really news, and I suspect the market will recognize that.
Slowing growth abroad
Let’s look at the second issue: slowing growth in Germany and China. German growth does indeed seem to be slowing, and this slowdown is worth watching. China’s data, however, seems to have improved somewhat recently and, in any case, remains at solid levels. Both are certainly worth paying attention to, but neither is signaling imminent economic trouble. At a higher level, given the export orientation of both economies, this slowing may also be a reflection of trade conflicts. As such, this situation is more political than economic. Although political worries can knock the market down, they can also reverse quickly, just as we saw earlier this month.
Main trends remain positive
Was yesterday’s pullback bad? Yes. But like any short-term movement, it was based on a knock to investor confidence, rather than real deterioration of the economic and corporate fundamentals. Confidence can bounce around, and pullbacks based on that can get bad. As long as the fundamentals remain solid, such pullbacks tend to be short, as we have seen several times in this bull market.
Although there are signs of economic weakness, the main trends remain positive. And while a recession will certainly occur at some point, the data suggests it won’t be soon. That alone should cushion any further volatility.
Will we see more turbulence?
It is very likely that we are in for more turbulence. Should we worry? Not yet. Despite the headlines and the concern, the market is still within 6 percent of its all-time high, and only back to levels of a couple of months ago. As pullbacks go, this remains a mild one. Although we should keep an eye on both the market and the economy—and there are indeed signs of risk—the trend remains positive.
Keep calm and carry on.


 Print
Print

