

 Print
Print I last looked at whether the housing market might be rolling over back in March. At that time, I concluded that the industry was indeed past its peak. I also determined that we were still not close to the end of the cycle. With all of the weak data we have seen from this sector recently, I thought it was a good time to take another look.
Housing matters
Housing is one of the key drivers of the economy. This is true from a fundamental basis, with housing driving not only construction and mortgage finance (significant parts of the economy) but also all sorts of indirect spending (e.g., furniture). But it is also true from a confidence and wealth-building perspective. Homeownership provides a level of economic security for most families that enables them to save and invest at higher levels, which is even before considering the substantial economic benefit of home appreciation. Housing matters for a reason.
Buying a house is, however, a major commitment. People who buy homes are making a multidecade commitment to pay the mortgage, as well as (usually) tying up a major part of their life savings. You have to be quite confident in your future to do that. Indeed, the housing market tends to ebb and flow with the economy as a whole for just that reason. Housing is not only an enabler of future growth but also a good signal of how strong that growth will be.
So with all that said, let’s take a look at what the housing market is telling us.
Housing affordability
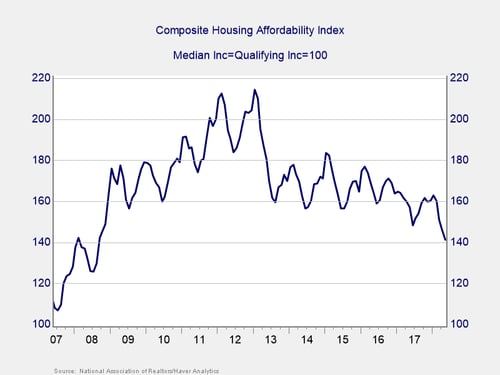
In the chart below, lower is less affordable. We can see that over the past several years, housing has become steadily less affordable. It is still, however, more affordable than it was in the 2000s, but the decline has no doubt cut off marginal buyers at the lower end of the income spectrum. Worth noting here is that affordability has recently taken a strong cyclical turn down. That may reverse somewhat in coming months, but the trend remains down—and the magnitude of the drops also seems to be worsening.
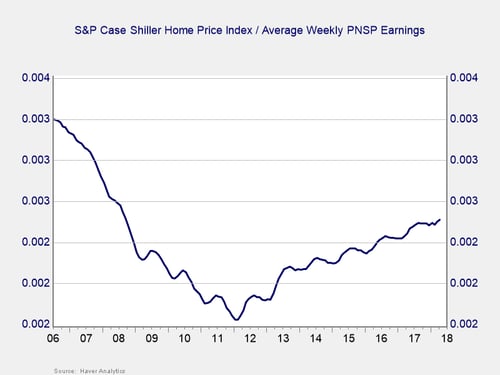
With housing prices continuing to rise faster than wages and with mortgage rates also rising, the trend of lower affordability is likely to accelerate. We can see that in the chart below, as the ratio of house prices to weekly income continues to rise. Housing prices have been increasing much faster than wages, but low interest rates have kept the affordability levels healthy. As rates start to rise, however, we can expect affordability to continue to erode—and at an increasing rate. The chart below shows that, relative to income, we are back to levels of 2007/2008. This suggests that housing may indeed have peaked.
Lower affordability implies lower effective demand. People may want to buy a house, but their demand is not effective if they can’t afford it. Lower demand would also result in lower sales levels, perhaps in lower development levels, and in a rising supply of homes available for sale.
Home sales
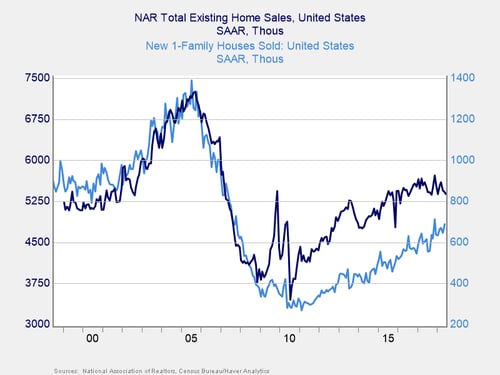
When we look at the sales data, we can see that sales of new homes are running well below levels of the early 2000s, before the housing boom. But sales of existing homes have largely recovered to that level. This data tells us two things. First, since existing homes are the majority of real estate activity, the market is pretty much back to normal—not much more room for growth. Second, new home sales look like they may be topping out as well.
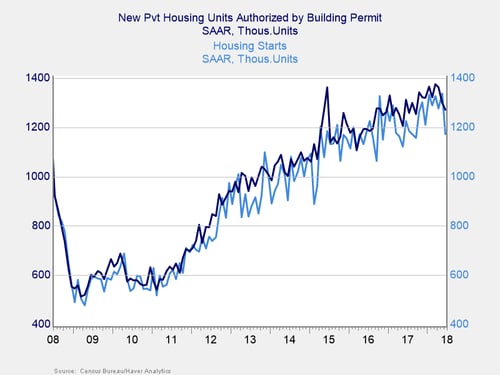
Housing starts and building permits
To check on whether new homes sales are topping out, we can look at actual housing starts, which are down for the third month in a row. They are also back to levels of mid-2016 and seem to be topping. We can also look at building permits, which also seem to have rolled over. Sentiment in the industry, which is surveyed monthly by the National Association of Home Builders, also looks to have topped out.
Things are not different this time
Of course, we can argue whether housing is at the end of the cycle. It probably is not, although we are getting closer. What looks very likely indeed, though, is that the industry really is moving into a down trend, with all that implies. If that is the case, we can also expect consumer confidence to start to roll over—and there are signs that it has.
While this certainly is not a sign of immediate trouble, it is one more wide-ranging indicator that economic conditions are indeed starting to change, and not for the better. Conditions remain good and will likely stay that way for the rest of this year and beyond. But this is one more reminder that, for the economy as whole, things are not different this time.


