

 Print
Print Yesterday we talked about future bond returns, noting that while bonds have done very well over the past several decades, current conditions suggest their returns over the next 10 years could be significantly lower. Today, we’ll focus on stocks, making the same distinction between returns from income and returns from capital gains.
A disconnect between historical returns and current projections
To start, let’s establish some context by looking at the returns stocks have historically achieved. According to economist Burton Malkiel, from 1926 through 2016, common stocks returned 10 percent per year on average. Most current projections are for future returns of around 7 percent. This seems like a substantial discount from history, but many notable investors are predicting even lower returns over the next decade, typically around 4 percent or so.
Why the difference, and what does that mean for us?
The most commonly cited reason for estimating lower future returns is current valuation levels. As I’ve mentioned many times before, stocks are expensive almost any way you look at it. According to many metrics, stocks are pricier than they’ve ever been, with the exceptions of 1929, 2000, and 2007. Although you can make a reasonable argument that these values are justified, given current interest rates, it’s almost impossible to argue that valuations should rise even further.
This matters when you consider where future returns have to come from.
Dividends. The current dividend yield on the S&P 500 is just over 2 percent—roughly equivalent to the coupon payments we discussed yesterday for the U.S. bond market as a whole. You can therefore expect to get roughly 2 percent of your forward stock returns from the dividend. Historically, the average dividend yield was 4.3 percent since the late 1800s, or 3.4 percent since World War II. Depending on how you look at it, the current dividend return is somewhere between 1.4 percent and 2.3 percent short of history. That reduces our expected returns by around 2 percent, so 10 percent becomes 8, and 7 percent becomes 5.
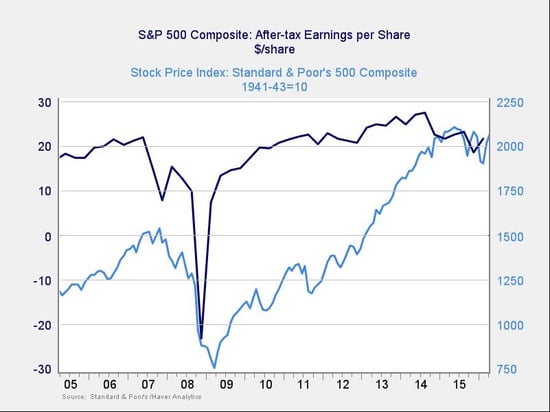
Capital appreciation. The balance of any return has to come from capital appreciation. Unlike bonds, where capital appreciation can come only from lower interest rates, stock values can grow from two sources: higher valuations and higher earnings. In fact, all of the capital appreciation over the past 10 years or so has resulted from higher valuations, as you can see in the chart below. Earnings have actually been pretty flat, even as the S&P 500 Index has increased substantially.
The following chart of valuations, using the price-to-earnings ratio, illustrates how this works. If we start in 2010, when earnings were close to current levels, we can see the market get pricier and pricier. Capital gains have come not from a rise in earnings, but from investors being willing to pay more for the same stream of earnings.
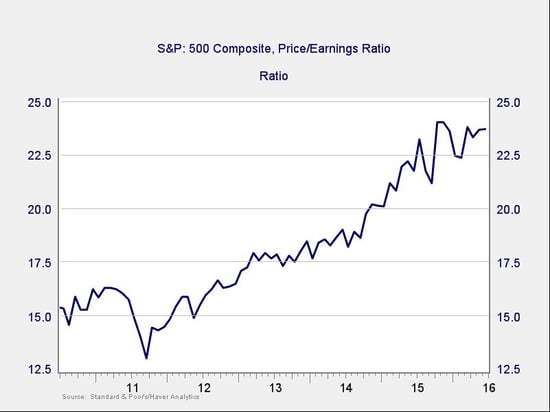
Right now, for investors to get more capital gains, they either need earnings to grow or valuations to rise. With valuations as high as they’ve ever been (with the exception of the late 1990s and 2007), any further increase is likely to be limited at best. So we're unlikely to get much capital appreciation from valuation expansion, which, along with low dividends, will be a headwind.
Finally, stock prices should rise in line with earnings, which, in theory, can grow without limit. In practice, however, earnings growth is restricted, mostly by the growth rate of the general economy. With growth slow around the world as well as here in the U.S., an increase in earnings is also likely to be limited—another headwind.
Putting it all together
We know that, compared with history, we are losing about 1 percent to 2 percent per year from lower dividends. We know that valuations are about as high as they get and are unlikely to increase and boost our returns—and may well decline. And we know that earnings growth, the sole remaining return generator, is likely to be lower than it has been as well.
In other words, all of the things that generate returns are likely to disappoint. Small wonder that many savvy investors expect returns over the next several years to be lower than they have been in the past.
And one more thing: none of this takes into account the potential for a bear market. A sustained decline in the market would depress returns for some time, potentially bringing down average returns for a decade or more, as has happened in the past.
In today’s environment, of course, returns of around 4 percent don’t look all that bad, which is worth remembering. What should matter most to investors is not the level of absolute returns, but the gap between those returns and their expectations. As investors, we need to recognize the very real risk that the returns we get may be less than the returns we expect—and plan accordingly.
Investments are subject to risk, including the loss of principal. Because investment return and principal value fluctuate, shares may be worth more or less than their original value. Some investments are not suitable for all investors, and there is no guarantee that any investing goal will be met. Past performance is no guarantee of future results. Talk to your financial advisor before making any investing decisions.


