 Why all the angst over the weak jobs number? Much of it is based on the assumption that a decline of that magnitude, especially after a very strong run, means we’re moving into shaky economic territory.
We might be, but let’s check the data before we get too upset.
One of the points I’ve emphasized in recent talks and articles is that, in many ways, the economy is approaching boom conditions. I’m not saying we are in a boom (so don’t send me e-mails about it), but in many areas, mostly related to employment, we’re at or above levels that typically prevail in boom times, specifically the 1990s and mid-2000s.
Job creation over the past 12 months was better, in fact, than at any point during the 2000s, and initial jobless claims are close to an all-time low, better than at any point since the 1990s, as a percentage of the labor force.
A look back at boom times
Given that, we can look at job creation during those acknowledged boom times to see when, and if, there were slowdowns similar to what we saw last month. And if we find any, we can then consider what happened next as a guide to what we might expect right now.
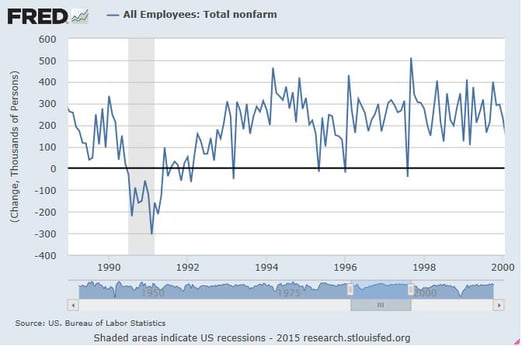
Let’s look at the 1990s first, per the following chart from the St. Louis Fed:

After the recovery, say around 1993 through 2000, there were 10 months with job creation of less than 150,000, of which 4 were actually below zero. That's about 10 percent of months over that time period. Three of the 10 months with lackluster job creation fell in the last year before the economy went into recession.
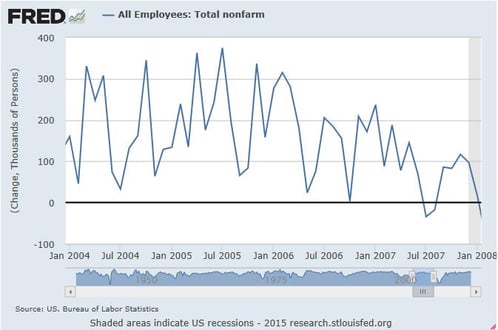
The 1990s were a strong and long-lived boom for a variety of reasons, which I will discuss in detail in later posts. Moving on to the 2000s, the boom period for employment was much shorter and much weaker, as shown in the following chart:

Here, we see job creation below 150,000 in almost a quarter of the months, significantly higher than in the 1990s. Similar to the 1990s, however, job creation does drop toward the end of the boom period, with more below-par months visible.
What does this mean for the current recovery?
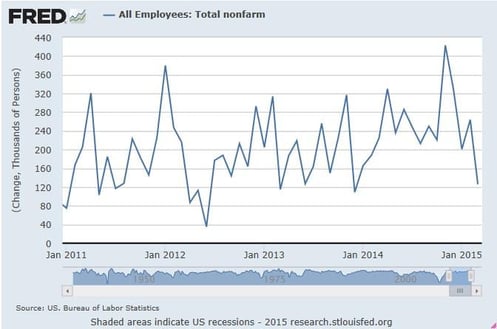
Let’s go to the chart:

Looking at approximately the past four years, since 2011, 13 out of 51 months, or about 25 percent, have been below the 150,000-job breakpoint. The current jobs recovery has been similar, then, in terms of downside exposure, to the mid-2000s period, although it has been superior in terms of job creation.
Comparing the current period with previous periods, we can draw a few conclusions:
- First, a drop in job growth to the level we just saw is not atypical, happening on average one month out of four in the 2000s and one month in 10 in the 1990s.
- Second, a one-month decline, or even a two-month decline, isn’t necessarily a sign of pending trouble. We saw this in 2013, 2004, and 1995.
- Third, when the one-month decline is associated with other indicators of strength, as we see now, the potential for trouble is even less.
Overall, based on history, a decline in job creation like the one we just saw is absolutely normal. The time to worry about a change in trend will be if we see depressed job creation for more than three months, or if the supporting indicators—jobless claims or the quit rate, for example—weaken.
Right now, a look at history suggests that a one-month decline is only that, and not something to worry about.


 Print
Print


