

 Print
Print Looking at the headlines, this has been a tough week for the U.S. economy. Interest rates spiked. Job growth dropped substantially. Oil prices are rising. So, we have three key economic and market risk indicators moving in the wrong direction, and markets dropped yesterday as a result. Is it time to panic?
Not quite yet. In fact, if you look at each of these items individually, they are not as bad as they sound.
Interest rates spiked
It is true that interest rates spiked, with the yield on the 10-year U.S. Treasury note breaking through the ceiling of the past several years to the highest level since May 2011. I wrote about this very possibility a couple of days ago, and it is happening even more quickly than I thought it would. To see whether this spike is a problem, however, we need to consider just why rates are rising. The answer is that the U.S. economy continues to do well, generating demand for capital on top of slowly rising levels of inflation. Interest rates are rising, yes, but as a reflection of a good economy—which is a good thing.
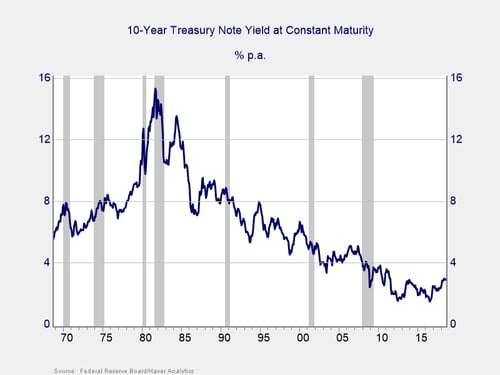
Another argument that rising rates are not the end of the world is that, even as they rise, they are still at post-2008 levels. Indeed, rates are very low by historical standards and well below the levels that prevailed during, say, the mid-2000s boom, as you can see in the chart above. Arguably, we are now moving back up to crisis levels and will move up even further to normal levels at some point. If we want a normal economy—and we do—that movement is exactly what we should be looking for.
Finally, rising 10-year rates help mitigate one of the major risk indicators out there: the yield curve. There has been a great deal of worry that short-term rates would rise above long-term rates, inverting the yield curve. In a normal, healthy economy, long rates should be higher. With the recent increases, that scenario is exactly what we are seeing, however belatedly.
Will this spike cause some turbulence? Quite possibly. Is it a sign of the end? Almost certainly not.
Job growth disappoints
This morning’s employment report showed that job growth came in at 134,000. This result was 51,000 below the expected 185,000. A problem, right? It could be, except previous months were revised up by 87,000. As a result, we are 36,000 jobs ahead of where we expected to be, despite the shortfall. The shortfall itself is likely due more to weather (i.e., Hurricane Florence, which hit during the week of the survey) than anything else. This conclusion is supported by the fact that wage growth remained strong on a monthly basis, and the unemployment rate ticked down further and is now at the lowest level since 1969.
Monthly volatility in job growth is normal, especially when major events like storms hit. With the strength of job growth in prior months and the supporting data, it is very likely this month’s report is much more a weather report than a jobs report. We will keep an eye on it, of course. But next month should revert to normal.
Oil prices rising
Last week, oil prices in Europe (Brent prices) hit $85 per barrel for the first time since 2014. This made the headlines, along with the fear that prices could go even higher, as Iran sanctions took that country largely out of the oil market. These were good headlines, and scary, except for the fact that prices in the U.S. track U.S. production, known as the West Texas Intermediate (WTI) index, rather than the Brent index. When looking at WTI, the news wasn’t quite as bad, with prices at $75 per barrel, not $85. Nonetheless, that level seems high by recent standards. Should we be worried?
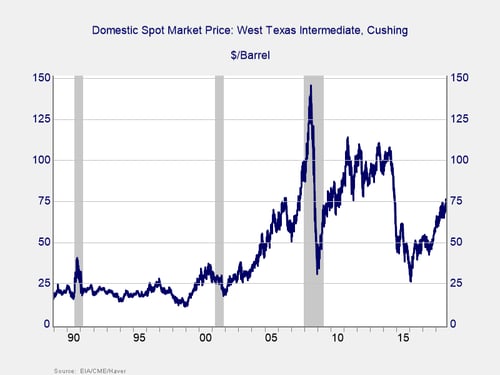
As you can see in the chart above, current U.S. oil prices are high based on the past four years. But they are still well below what we saw in the aftermath of the crisis, when they were about $100 per barrel. By postcrisis standards, oil is still pretty cheap, if not as cheap as it has been recently. This change may warrant some worry but not necessarily immediately.
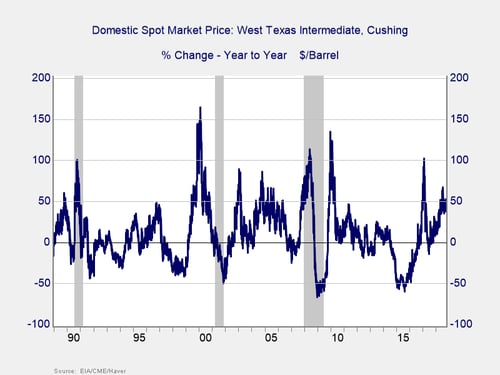
A better indicator of risk is how oil prices have changed. In the chart above, we can see that they are up by about 50 percent over the past year. This trend has, historically, not been a significant problem for growth, at least to the point that it drives the economy into a recession. Once again, rising oil prices are something to watch but not an immediate problem.
Markets dropped
Financial markets are not known for their cool, reflective responses to bad news. They drop and then think about it. Given that, yesterday’s drop makes sense, as does today's struggle. But it does not mean a continued decline is inevitable.
Not time to worry (yet)
Given the strong foundations of the economy—high confidence, strong year-on-year job growth, and solid business investment—the rising headwinds from higher interest rates and oil prices are likely to slow growth but not to reverse it. As such, markets are also likely to be supported, even as growth slows. At some point, it will be time to worry. This week’s news may bring that point closer. But chances are, we are not there yet.


