

 Print
Print This past week revealed a mix of improvement and stabilization in the COVID-19 pandemic. While testing continues to expand, the progress in slowing the spread rate and case growth has stalled, leaving both at levels consistent with the past two weeks. The number of active cases has started to grow again, which is a negative. Overall, conditions remain much better than they have been in recent weeks, but we did not see much, if any, additional progress in controlling the virus.
This news is actually better than it looks, however. Last week coincided with the start of the reopening of the economy and the loosening of social distancing measures in several states. In fact, the data shows that social distancing had been subsiding in many areas even before the formal loosening. So, last week represented the start of a new environment for the spread of the virus. One of the biggest concerns in that new environment was for a second wave of infections. This week’s pause in the reduction in new cases suggests there may be some effect. But so far, at least, the virus remains substantially under control. Let’s take a look at the details.
Pandemic growth still slow
Growth rate. Over the past month, the new case growth rate has declined from about 5 percent per day to the present level of less than 2 percent per day. Over the past two weeks, however, the growth rate has stayed steady at around 1.5 percent per day. If that growth rate holds, the number of cases will double about every seven weeks. We have succeeded in flattening the curve, but the virus continues to spread.
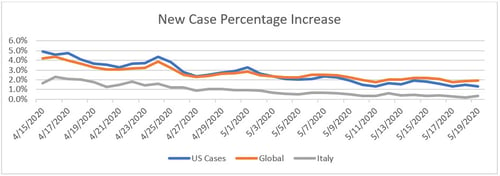
Source: Data from worldometer.com
Daily testing rate. We have made more progress on testing, with the daily test rate up from just about 300,000 per day last week to about 400,000 per day in the past several days. While this is still not where we need it to be, it represents real progress.
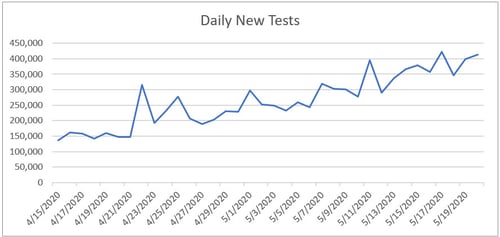
Source: Data from the COVID Tracking Project
Positive test results. Another way of seeing this progress is to look at the percentage of each day’s tests that are positive. Ideally, this number would be low, as we want to be testing everyone and not just those who are obviously sick. The lower this number gets, the wider the testing is getting. Here again, we can see the positive level has halved from the peak. More people are getting tests, which means we have a better grasp of how the pandemic is spreading.
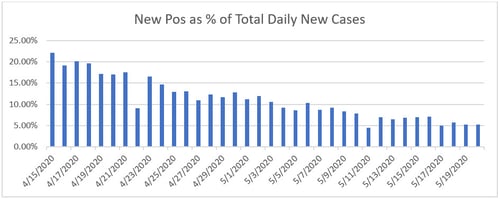
Source: Data from the COVID Tracking Project
New cases per day. Despite the growth in testing, however, the improvement in new cases per day has paused, with cases stabilizing between 20,000 and 25,000 per day. But this number is somewhat better than it looks. With the wider range of testing and the number of tests growing, other things being equal, we would expect reported cases to increase in proportion to the number of tests, which has not happened. With the reopening, we would also expect to see more new cases—which has not happened. Stabilization, in this context, continues to be positive overall.
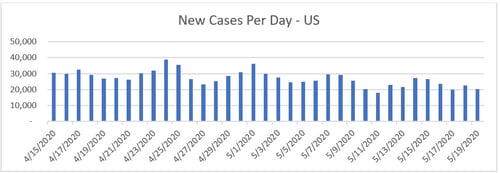
Source: Data from worldometer.com
Total active cases. The continued growth in new cases has led to an increase in active cases, likely due in part to the reopening. After a brief pause, active cases have been rising at 10,000 to 12,000 per day over the past couple of weeks. Although this is a significant improvement over a month ago, this area remains one to watch.
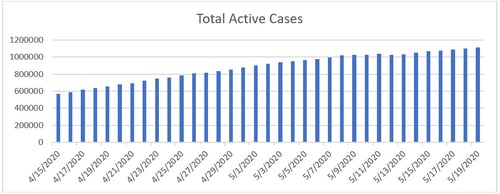
Source: Data from worldometer.com
Overall, the pandemic continues to be largely under control, even though we saw minimal further improvement last week. The reopening is providing increased opportunities for the virus to spread, which may be a big part of the pause in improvement. But the good news is that we do not yet see any signs of a major second wave of infections, something we need to watch for.
The economy bottomed in April
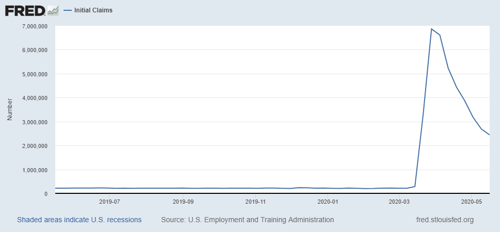
Jobs market. While layoffs continue, there are signs that the damage may have peaked and has started to recede. Weekly initial unemployment claims continue to decline from the peak, suggesting that much of the damage has already been done.
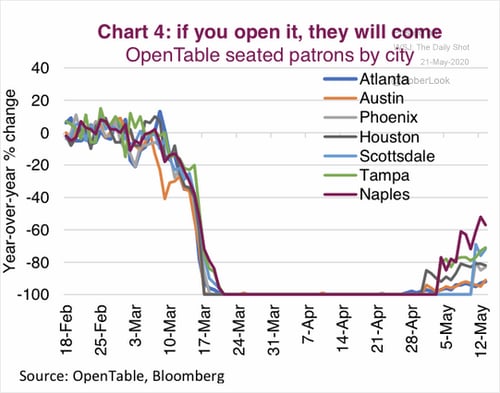
With the reopening, we should also start to see people moving back into work. One of the hardest hit areas of the economy, restaurants have started to come back in many areas. There is still a long way to go, but the process has started.
The risks. Although the reopening is going better than expected and is clearly having some positive economic effects, as we reopen we certainly face risks. The biggest of these is a second large wave of the pandemic. We have not seen that yet, though, which is a positive sign, as it suggests that most people are continuing to act in a safe manner. The real test will come in the next couple of weeks, however, when the full number of any new cases arising from the reopening will start to show up.
Another potential risk is that, even with the reopening, consumers will be slow to return and spending growth will not return to what was normal any time soon. This outcome seems possible, although the early signs are positive, with restaurants coming back faster than expected (as shown above). Another positive sign is that mortgage applications are almost back to 2019 levels, which would drive additional spending, and Google searches for vehicle sales have also rebounded significantly. While risk of a slow spending recovery still exists, early data shows that spending might come back faster than anyone expected.
For the financial markets, now that the reopening is underway, markets have been reassessing the risks, and we have seen some volatility. While that risk remains, the good news is that as we get that data, markets will have a much firmer foundation. The past week’s data has been positive on the whole and markets have responded—a trend that will likely continue if the news remains positive.
Another good week
The real takeaway from this past week is that progress continues, to the point that a successful reopening over the next several weeks looks quite possible. We are not yet out of the woods, and there are certainly significant risks going forward, with a second wave of infections being the biggest. But the thing to keep in mind is that many of the biggest risks are moving behind us. Another good week.


