

 Print
Print One of the most urgent and consistent questions I have been getting recently is around inflation. With the headline numbers high—and they are high—the concern is that we are moving back to the 1970s and that inflation will stay at the current 5 percent or run even higher. That conclusion seems reasonable, given the large federal deficit and spending over the past couple of years. When combined with the signs of slowing growth, it could point back to stagflation. The 1970s are calling. Maybe disco will come back as well?
Back to the 1970s?
All of this could happen, and there are signs inflation will start running somewhat hotter in the next couple of years. But I am still unconvinced the 1970s are back. We do have high inflation numbers, but we also have good reasons to believe those high numbers won’t persist for much longer. We do have backward-looking data that looks scary, but the forward-looking trends look better. And we do have slowing growth, but that slower growth is just getting back to the pre-pandemic normal, which is arguably what inflation is doing as well.
I looked at inflation about a month ago, when the last data release came out. The conclusions were that, yes, inflation was high, but coming down from the peaks, and that much of that increase was due to a handful of components. My conclusion was that inflation was showing signs of rolling over and returning to more normal levels.
Where We Are Now
As of this morning, we have another monthly release, and that conclusion looks pretty good. The consumer inflation numbers were down again—still too high, but clearly the trend is now down. You can see that trend in the following chart.
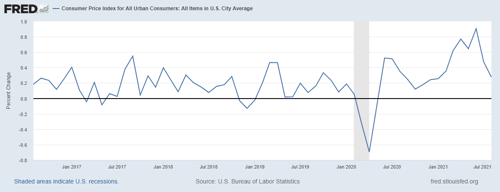
You can see a couple of other things as well. Inflation started to spike roughly a year after the pandemic started, which makes sense as the numbers as reported reflect year-on-year changes. Demand (and prices) collapsed at the start of the pandemic. But later, when the economy was full of stimulus and reopening, you would expect to see demand (and prices) increase over that collapsed level—and we did. That shift explains the increase in inflation earlier this year.
Similarly, once the stimulus and recovery hit full force, say in July or so of 2020, you would expect to see the yearly inflation number start to drop about a year later, around July 2021. Again, this is exactly what we saw. As the year-on-year numbers get less distorted, moreover, you would expect to see the inflation numbers drop back into the range we saw before the pandemic. Once more, that is exactly what we are seeing. The most recent monthly number came right in line with what we saw in the years before the pandemic.
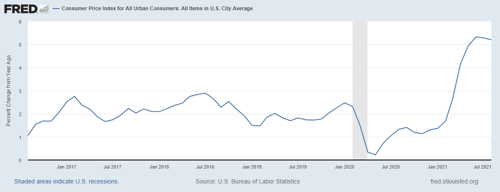
You can see the same change in trend, although less sharply, in the year-on-year numbers. Inflation is now well above the pre-pandemic range. But that is because during the pandemic itself, it dropped well below that range. While it is still way too high, it is now rolling over and likely to do so more quickly in the coming months, based on the monthly data. From a bit above zero at the start of the pandemic to a bit above 5 percent now, if you take the middle of that range (bottom to top), you get somewhere between 2 percent and 3 percent—or right where inflation was from 2017 through 2018.
Note that this is above where inflation was in 2019 and 2020, so we might well see somewhat higher inflation going forward. But, as 2018 and 2019 told us, we can live with that. What we do not see is sustained 5 percent or higher inflation. The components that pushed inflation to that level are largely rolling over. The year-on-year basis that generated those numbers is no longer in effect, and companies are working hard to solve the supply problems.
How Long Will Inflation Run Hot?
Will this change happen immediately? No. We will likely see inflation run hot for at least the rest of the year and quite possibly into 2022. But we do see the change in trend, which shows that the change in basis is taking effect and that the economy is healing.
What I said a month ago still holds. Could inflation rise further? Of course. Will it rise? Maybe, for a while. But, ultimately, it will likely rise only a bit more quickly over time than it has over the past several years, once the economy normalizes again. Do we need to pay attention? Yes, which is what we are doing right now. But do we need to make significant changes to what we are doing? No—not yet.


