

 Print
Print Chalk another point up on the board for the importance of context. Yesterday’s economic data release showed that the economy actually shrank in the last quarter, down by 1.4 percent at an annual rate. This result was down from 6.9 percent in the prior quarter and well below the expected 1 percent growth rate.
With the recent alarms from the inversion of the yield curve, as well as the worries around the impact of inflation, the war in Ukraine, and, of course, Covid-19, it seems reasonable to ask whether this means the start of a recession. Is the recovery over?
Not So Fast
When we look at the details, the news is much less worrying. First, let’s consider where that number comes from. The economy consists of several components, with the biggest typically being consumer spending and business investment. Within those components, two subcomponents that can be variable are housing and inventories. Other, typically less important, components of growth are government spending and net exports. All of these add together to get total growth, which normally provides a fairly predictable result.
These are anything but normal times, however. Even though we are moving back to normal, we are not there yet. If you look at the chart below, which breaks down economic growth for the past several years, you can see how changes in consumer spending are usually a primary driver for growth. That makes sense, as this is the largest part of the economy. But you can also see that sometimes things get weird, and other components act up on a short-term basis. And that is what happened last quarter.
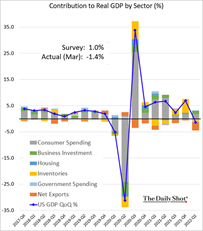
Source: The Daily Shot
If we zoom in on the most recent data, we can see that more clearly. Here, we see that consumer spending continued to grow strongly and that business investment has been improving after a weak couple of quarters. Housing has also contributed a bit. These components are the core of the economy, and as long as they keep growing—as they have been—the country does well.
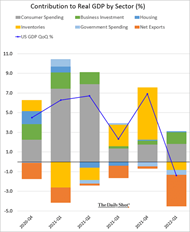
Source: The Daily Shot
Headwinds to Growth
Three things hurt us last quarter. First, government spending declined. This is a good thing, as pandemic spending runs off, but it does make for a short-term hit to growth. Second, business inventories were down a bit, which makes sense when you look at the huge gain in the prior quarter. At the end of last year, companies ordered as much as they could to try and get around the supply chain issues. But having done so, they really didn’t need to order as much this past quarter, which explains that shortfall.
Finally, that order surge and the subsequent improvement in the supply chains also explain the biggest headwind for growth last quarter: the significant rise in the trade deficit, which took the net exports line item down. Simply put, we imported much more than we exported, again, as all of those orders came in as supply chain problems eased. That drove the trade deficit up—and the growth number down.
Signs of Strength
Despite that, the demand for goods is a sign of economic strength. The fact that they were delivered is a sign that supply chain problems are getting better. But because that all happened last quarter, it looks like a problem, and it is a problem from an economic accounting perspective. From a real economy perspective, though, it is not nearly as concerning.
This brings us back to context. When you look at the economic accounting, the U.S. economy did indeed shrink last month. But when you look at the reasons for that? You get the opposite of a recession signal. Consumer spending is so strong it drove companies to stock up as much as they could, in many cases on imports. Supply chains improved so those stocks largely arrived last quarter. And companies now are largely fully stocked. With job growth and spending strong, these are not signs of a looming problem.
Risk of Recession?
That said, we may be seeing signs of slowing. The inventory drag may persist, as may the large trade deficit. There are reasons to believe growth will be slower going forward, and we need to pay attention to that. But when you look at the core of the economy, the momentum in job growth, confidence and spending on the consumer side, and confidence and investment on the business side shows that the risk of a recession remains low for this year.
When you look at the details, in other words, this is a measurement problem, not an economic problem. And if we do get a quarter like the last one, those are exactly the reasons we want to see.
Keep calm and carry on.


