 Today’s post comes from Anu Gaggar of Commonwealth’s Investment Research team. Take it away, Anu! —Brad
2017 has turned out to be a turnaround year for international equities and sentiment toward investing in markets outside the U.S. I can attest to this wholeheartedly, as I am no longer fielding calls asking for justification of an allocation to international markets! But why?
After several years of underperformance, non-U.S. markets are positioned to end the year outperforming U.S. markets. It seems the perfect time, then, to analyze the drivers of performance for non-U.S. markets in 2017—and what we might expect in 2018.
Returns for U.S. investors
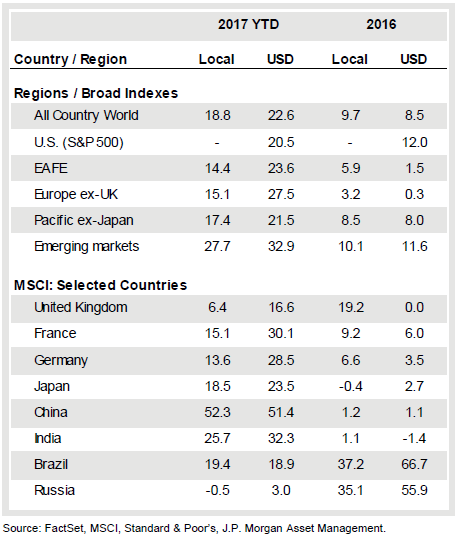
For U.S. investors, non-U.S. equities have generated better returns than their domestic counterparts in 2017. A closer look at returns reveals that our friends across the pond did not fare as well. In U.S. dollars, EAFE equities advanced 23.6 percent year-to-date (as of the end of November) compared with a return of 20.5 percent for the S&P 500. In local currency terms, however, EAFE equities lagged with a return of only 14.4 percent. This indicates that a bulk of the returns in EAFE equities has been driven by currency moves. It is a complete flip-flop from 2016. At that time, EAFE equities returned 5.9 percent in local currency terms but lost most of these gains in currency translation, returning only 1.5 percent for U.S.-based investors.

Emerging markets had a similar story to tell, just to a lesser degree. Emerging markets ended the first 11 months of 2017 with a 27.7-percent return for U.S. investors versus a 32.9-percent return for local currency investors. This certainly wasn’t a year for hedging your currency exposures!
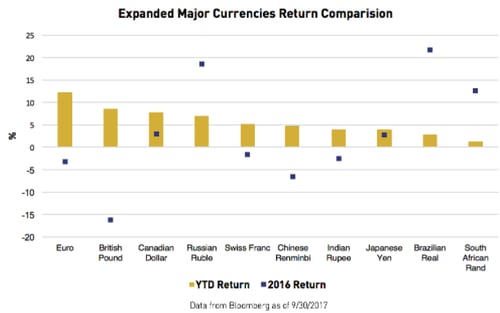
Finally, when comparing the 10 major developed and emerging market currency returns against the U.S. dollar, we find that half of them underperformed the U.S. dollar last year—but all 10 outperformed this year. Consider this in the backdrop of three rate hikes by the Fed.
What about international investors?
For international investors, the currency story in 2017 was primarily one of the euro versus the U.S. dollar and was driven by geopolitics. The euro began appreciating in earnest after the French presidential elections in May 2017, when markets breathed a sigh of relief as a pro-European Union president was elected. Appreciation of the pound and renminbi were also noteworthy. The British pound recovered somewhat from the bottoms it touched last year following the Brexit vote. Easing concerns of capital flight, economic hard landing, banking crisis, and foreign-exchange reserve depletion saw the Chinese renminbi appreciate nearly 5 percent this year.

Source: Kraneshares
A closer look at valuations
At the risk of sounding like a broken record, I would like to reiterate that the S&P 500 is trading at valuations that are well above the 15-year median and average. As Brad has pointed out, this does not necessarily imply that we should expect a reversion to the mean in the near term. Turning our attention to international valuations, however, the gap between U.S. and non-U.S. valuations hasn’t quite narrowed, despite the outperformance of non-U.S. equities in 2017.
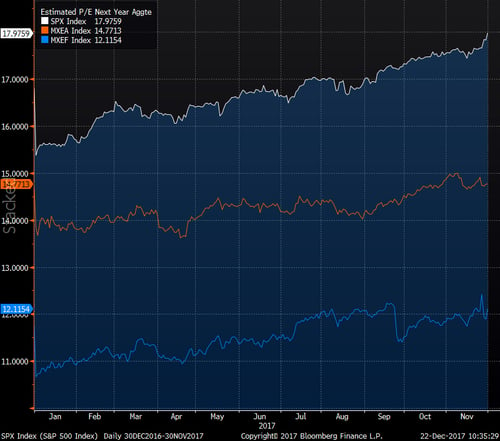
Let’s look at the trailing P/E ratios at which the S&P 500, MSCI EAFE, and MSCI EM indices have traded through 2017. We see that while the EM equities have seen forward P/E expand from 11.74 times at the end of last year to 12.11 times at the end of last month, EAFE equities ended last year trading at 14.67 times forward P/E and last month trading at 14.77 times. By comparison, the S&P 500 began the year at 16.8 times and ended last month at 17.98 times. If you look at longer-term history, EAFE and EM equity valuations have also risen meaningfully, implying that they are not necessarily cheap relative to their own histories.

Source: Bloomberg
These figures appear to indicate that there is relatively more room to run for international equities as synchronized global growth, reduced geopolitical risks, and stability in commodity prices augur well for stronger economic data and earnings growth for companies. Non-U.S. companies, like many of their U.S. counterparts, are sitting on piles of cash reserves. As these companies reach operational capacities, stronger demand could encourage them to start investing in existing operations or expand through mergers and acquisitions.
What are the risks?
Certainly, there are risks on the horizon. As prudent investors, we need to be aware of those risks and monitor them. Currencies, which were a big tailwind in 2017, could turn into a headwind in 2018 if the U.S. starts attracting more capital on account of higher short-term rates and lower taxes. Global growth, while synchronous, is still on fragile ground, and sustainability will be the key here. Brexit negotiation proceedings continue to pose a risk for the U.K. and broader Europe. The U.S. might be the first to embark on tightening, but Europe could follow suit. Remember the 2013 taper tantrum? Much of the commodity demand and an increasing proportion of consumption demand are driven by China. So, if China sneezes, the rest of the world could catch a cold. Finally, living in a low-rate world for an extended period of time, investors have become desensitized to stretched valuations, and equity risk premiums are at record lows—a recipe for potential asset bubbles.
Here’s what we know
Overall, we know two things. First, the fundamentals for international markets are better than those of U.S. markets, with lower valuations and faster growth. This suggests we should be more exposed to them. Second, we know that recent gains have come from currency effects. Doesn’t that argue for staying in the U.S.? In a word, no.
As I noted, currency effects were positive for U.S. investors last year—but they were negative the year before. Currency effects change over time, but ultimately fundamentals will control. The better fundamentals abroad indicate investors need that exposure regardless of what the dollar does next year. With U.S. markets at close to all-time-high valuations, the need for diversification is very real—and the advantages of international markets even more so. In other words, global diversification may well be worth the risks.


 Print
Print

