

 Print
Print Brad here. One of the great things about this blog is that it sparks quite a few questions. When we see the same question popping up, it is something we try to address. Today’s post, by Nick Follett, does just that, looking at some of the dislocations in the financial markets that have been worrying advisors. It is a bit more inside baseball than we normally do here, but it gives a good look at what is really going on. Thanks, Nick!
Credit leads equities?
The implication of this saying is that before problems arise in the stock market, they have already occurred in the bond market. As such, investors often draw clues into equities based on recent happenings in credit. Right now, we’re seeing an uptick in defaults and general underperformance in the lowest parts of the high-yield market, specifically within CCC-rated bonds. When cracks start to appear in lower-quality debt, the question that first comes to mind is, how bad is it? We’ve already seen the cash market bubble up. So, if both the safest and riskiest parts of the bond markets are showing weakness, what’s happening?
Fixed income investing, like all other investing, is a trade-off between risk and reward. Obviously, the more risk you take, the higher the expected return. Applied to credit, when you’re purchasing the lowest-rated (and therefore most risky) bonds, you would expect to get paid more than if you purchased higher-rated (less risky) bonds. Pretty basic stuff. But what happens when that’s not the case?
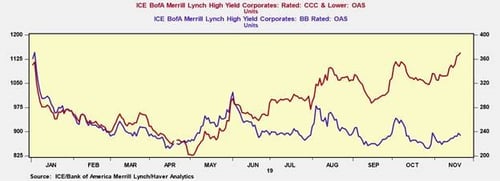
Lower-quality high-yield has been trailing higher-quality high-yield, the opposite scenario of what one would expect. Problems are starting to show in the debt market. So, if credit leads equities, let’s look at what’s happening in the bond market by addressing (1) what’s going on with CCC-rated bonds on an absolute level and (2) why the bond market is underperforming on a relative level. The former is due to fundamentals (i.e., the bonds themselves), and the latter is due to technicals (i.e., general market appetite).
The CCC market
In an environment like 2019 where risk has been rewarded, lower-quality high-yield should be outperforming higher quality. This hasn’t been the case, however, mainly due to weakness in the energy sector. Over the past 12 months, high-yield energy defaults have been roughly 8 percent, while the overall market has been about 3 percent. To put those numbers in context, the 30-year average default rate is slightly less than 4 percent. This difference would lead one to believe that oil prices have moved dramatically lower. But they haven’t.
Oil prices have been down only slightly. But there has been clear dispersion in the market, with more levered companies bringing down the overall valuations in specific high-yield sectors. Lower-quality energy names have shown continued weakness, but there has been forced selling in the market. Rating downgrades have been applied to many midquality drillers, kicking newly distressed rated borrowers out of the index. All of these factors have led to bifurcation in performance within the energy sector, with higher-quality high-yield outperforming lower quality.
Year-to-Date Returns, %
| Rating | Energy | HY Ex-Energy |
| HY | 11.8 | 13.8 |
| BB | 9.1 | 14.3 |
| B | 0.4 | 13.7 |
| CCC and lower | –28.4 | 11.0 |
On an absolute level, CCC spreads have widened and CCC bonds have underperformed due to weakness in low-quality oil operators.
A supply/demand imbalance
Weakness in energy issuers is the most obvious culprit here. I think there’s a second component as well: an overall risk-off sentiment by managers in the high-yield space creating a supply/demand imbalance. It’s been well documented that 50 percent of the corporate bond market is rated BBB. Counterintuitively, the overall spread (or risk premium) on the asset class has generally come down over the past decade. Not to mention the overall decline in yield in government bonds. This dynamic has forced an insatiable quest for income.
Year-to-date (according to Morningstar), intermediate-term and multisector bond funds, likely candidates to purchase corporate bonds, have seen the first and fifth largest inflows, respectively, amounting to $172 billion; however, managers that invest in sub-investment-grade bonds have been moving up in quality. This shift has driven the spreads on less risky high-yield down. Peak-to-trough last year (October 2–December 26), the CCC index was down 12 percent. For reference, the S&P 500 was down 15 percent during that same time period. As such, spreads have been forced to widen in the CCC space as investors demand more compensation for the increased risk.
Don’t get caught offsides
Let’s look at two real-world examples of this situation at play. Last fall, a credit-heavy multisector fund was down 5.5 percent during our reference time frame (October 2–December 26). A different multisector fund, focused on Treasuries and mortgages with very little in high-yield, was up 41 bps over the same period. When the credit-intensive fund managers came to meet with us last month, they talked about how they still like high-yield but are taking a conservative approach to risk-on market sentiment. They’re now holding BB bonds over CCC to avoid a similar situation. Managers are crowding the BB market and leaving lower-quality high-yield. The massive inflows discussed above have been forcing prices higher.
On an individual issuer basis, Twitter came to market with an 8-year, $600 million deal. The deal was originally priced in at about 4.5 percent for the BB+-rated bonds. Even before it started trading, the yield had gone down to 3.75 percent, with investors clamoring for “quality” junk bonds. After two days of trading, it’s currently priced at a premium.
On a relative basis, BB bonds have become more attractive as investors have concerns about the lower-quality high-yield. This supply/demand dynamic has driven spreads on BB tighter and those on CCC wider. Lenders are demanding significantly more to take on increasing risk.
Tremor or earthquake?
With $13 trillion in global fixed income assets trading with a negative yield, it was inevitable that investors would be pushed into riskier assets to maintain their current income. Where it becomes a problem? When investors aren’t aware of what they’re holding and subsequently don’t recognize the underlying risks associated with their bonds and bond funds. And while it’s important to watch what’s happening in lower-quality credits, there isn’t one be-all and end-all signal for market timing, and this is just one of many metrics we look at. With that in mind, we’re cautiously sanguine about the markets with a bias toward quality.
Now is not a time to be complacent in the debt markets. It’s paramount to understand the risks, both fundamental and technical. Of course, not every tremor is an earthquake. But given our proximity to the fault lines, it’s good to keep an eye on a seismograph.


